
Azure VM Diagnostics (ARM モード)
- Windows Server 編
- Linux 編
こんにちは。
Microsoft Azure 上の Virtual Machine を使った開発で、いわゆる「ログ」を考える場合、Azure Portal で Audit Log (監査ログ) として見えている Azure Resource の Provisioning Log、OS レベルのイベントなども含んだ Diagnostics (診断ログ)、Application レベルのモニタリングや可視化のためのさまざまなオプションを含んだ Application Insights の 3 つの方法があります。
本投稿では、このうち Azure Virtual Machine (VM) の Diagnostics (診断ログ) について記載します。(今回は Windows について解説し、次回は Linux 編を解説しようと思います。)
もちろん、この Azure にビルトインされた診断機能を無理に使う必要はありませんが (例えば、コマンドやプログラムを経由して VM 上のログを直接参照しても構いません)、Auto-Scaling など Azure Diagnostics が必須のケースもあるので、Azure を利用される場合は、是非、この診断機能を理解しておいてください。
Azure VM における診断構成 (超概要)
IaaS v2 における Diagnostics は、実は、v1 時代の Windows Azure Diagnostics (WAD) を継承したものになっています。(正直、はじめての方にはわかりづらいかもしれませんが、v1 の Azure Cloud Service などの構成経験がある方は むしろ扱いやすいはずです。)
Azure Portal を見てください。 Virtual Machine (仮想マシン) を開くと表示される [Diagnostics] (診断) を選択すると、下図の通り、どの診断ログを出力するか設定できます。
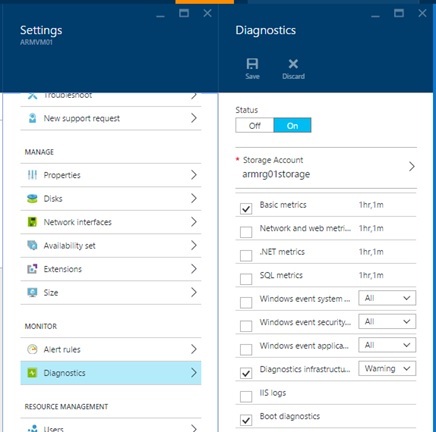
下記の診断が出力可能です。
| Diagnostics の内容 | Config の要素 (後述します) | 備考 |
|---|---|---|
| Azure Diagnostic Infrastructure Logs | <DiagnosticInfrastructureLogs /> | |
| Performance Counters | <PerformanceCounters /> | Windows の Performance Counter で参照可能なカウンター値で、Azure Portal (上図) で Basic Metrics, Network and Web Metrics, .NET Metrics, SQL Metrics を選択した場合がここに該当します。 |
| Windows Events | <WindowsEventLog /> | Event Viewer で参照可能な Windows Event で、Azure Portal (上図) で Windows event system logs, Windows event security logs, Windows event application logs を選択した場合がここに該当します。 |
| IIS Logs | <Directories><IISLogs /></Directories> | |
| IIS Failed Request Logs | <Directories><FailedRequestLogs /></Directories> | |
| Crash Dumps | <Directories><CrashDumps /></Directories> |
出力先
診断の結果 (ログ) は、VM 上で動作する Guest Agent の Plugin (DiagnosticsPlugin) と Monitoring Agent によって、Azure Storage に保存 (Heartbeat) されるので、ユーティリティやプログラム (REST) などを使って内容を参照できます。(上図で指定した Storage Account に保存されます。)
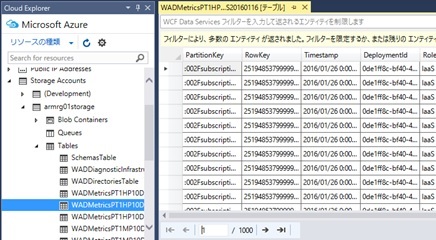
上記の Azure Diagnostics Infrastructure Logs, Performance Counters, Windows Event は Azure Table Storage に格納されます。(例えば、下図は、Azure SDK の Cloud Explorer で内容を確認しています。)
特に、基本的な Metrics は、Azure Portal の「Monitoring」ブレードを使って (時系列の推移を) ビジュアルに表示することも可能です。(下図の通り [Edit Chart] を選択して、表示する Metrics も変更できます。)


上記のうち、IIS Logs, IIS Failed Request Logs, Crash Dumps は Log ファイルを転送するもので、ファイルはディレクトリ階層も含めて Azure Blob Storage に保存 (転送) されます。(Azure Table Storage ではありません。)
なお、上図の Azure Portal で選択可能な「Boot Diagnostics」(Boot 時の Hypervisor レベルの出力結果を確認できます) は IaaS v2 (ARM ベースの Azure Virtual Machine) から導入されたもので、ここで解説する Diagnostic Config を使ったものとは別の仕組みです。内部的には、Hypervisor レベルの出力結果がイメージ ファイルとして Azure Blob Storage に保存され、Azure Portal から参照できます。ここでは Boot Diagnostics の解説はおこないませんが、詳細は「Boot Diagnostics for Virtual Machines v2」を参照してください。(Linux も同様です。)
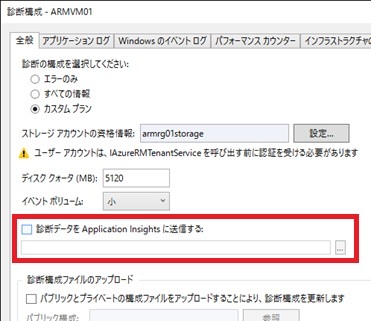
補足 : ここでは Application Insights の解説はしませんが、この診断ログを Application Insights に送ってビジュアルに可視化することもできます。(下図は Visual Studio を使って構成している例です。)
補足 (2016/04 追記) : Azure Diagnostics を Event Hub に Stream 送信することが可能になりました。これにより、Stream Analytics, HDInsight, Machine Learning などと組み合わせた高度な分析で活用することもできます。(詳細は「Microsoft Azure : New features for Azure diagnostics and Azure Audit logs」を参照してください。)
診断構成スキーマ (WadCfg)
このあとの解説に進む前に、予備知識として、XML の診断構成スキーマについて説明します。(これを理解していないと、このあとのコマンドを使いこなすことはできません。)
上記では UI (Azure Portal) を使った設定方法を紹介しましたが、この構成内容は、内部では XML で管理されています。例えば、以下のもっとも簡単な構成例を見てください。
<WadCfg> <DiagnosticMonitorConfiguration overallQuotaInMB="4096"><PerformanceCounters scheduledTransferPeriod="PT1M"> <PerformanceCounterConfiguration counterSpecifier="Processor(_Total)% Processor Time" sampleRate="PT15S" unit="Percent"><annotation displayName="CPU percentage guest OS" locale="en-us"/> </PerformanceCounterConfiguration></PerformanceCounters><WindowsEventLog scheduledTransferPeriod="PT1M"> <DataSource name="System!*"/></WindowsEventLog><Metrics resourceId="/subscriptions/b3ae1c15-4fef-4362-8c3a-5d804cdeb18d/resourceGroups/RG01/providers/Microsoft.Compute/virtualMachines/testwin"> <MetricAggregation scheduledTransferPeriod="PT1H"/> <MetricAggregation scheduledTransferPeriod="PT1M"/></Metrics> </DiagnosticMonitorConfiguration></WadCfg>この構成例では、System 関連 (System Channel) の Windows イベントと、Performance Counter として「CPU (コア) すべて (_Total) における非アイドル状態の時間のパーセント」(Windows の Performance Counter における登録済カウンターです) を 15 秒ごとに収集しています。
この XML のスキーマ構成については「Azure Diagnostics Configuration Schema」を参照してください。ただし、Azure VM に設定する場合、上記の通り、Virtual Machine の resource id など、リソースに依存した情報も含まれるので注意してください。
この構成ファイル (XML) を扱えるようになると、このあとで述べる Windows PowerShell や Resource template を使用して、Azure Portal (UI) で扱えない細かな設定が可能になります。例えば、下記は、.NET のアプリなどから独自の Windows Event を出力して、そのイベントのみを抽出する構成例です。(本来、アプリケーション側のトレースは上述の Application Insights を使用すると良いですが、ここでは敢えて、診断ログのみを使って構成します。Application Insights では、リアルタイムでの状況の可視化なども可能です。)
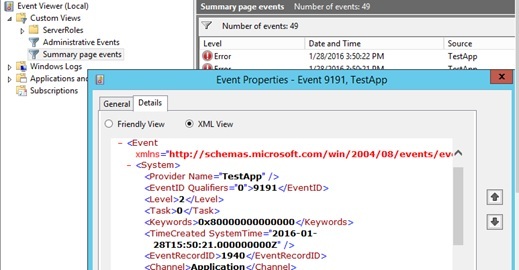
<?xml version="1.0" encoding="utf-8"?><PublicConfig xmlns="http://schemas.microsoft.com/ServiceHosting/2010/10/DiagnosticsConfiguration"> <WadCfg><DiagnosticMonitorConfiguration overallQuotaInMB="4096"> <WindowsEventLog scheduledTransferPeriod="PT1M"><DataSource name="Application!*[System[Provider[@Name='TestApp']]]"/> </WindowsEventLog> <Metrics resourceId="/subscriptions/b3ae1c15-4fef-4362-8c3a-5d804cdeb18d/resourceGroups/RG01/providers/Microsoft.Compute/virtualMachines/testwin"><MetricAggregation scheduledTransferPeriod="PT1H"/><MetricAggregation scheduledTransferPeriod="PT1M"/> </Metrics></DiagnosticMonitorConfiguration> </WadCfg></PublicConfig>// Sample of C# : post custom windows eventusing System.Diagnostics;. . .EventLog.CreateEventSource("TestApp", "Application");System.Diagnostics.EventLog.WriteEntry("TestApp", "Hello Test", EventLogEntryType.Error, 9191);なお、上記の DataSource の中で記載している式は Windows Event のスキーマ構成 (下図の XML) に沿った条件式です。上記では = (等号) を使った簡単な条件抽出をおこなっていますが、> (>), < (<) や or などの論理演算も組み合わせて条件に合うイベントを柔軟に抽出できます。
診断構成 (Diagnostics Config) では、この他に ETW (Event Tracing for Windows) も扱えます。
このあとの Resource template の説明で述べたいと思いますが、上述の Azure Portal (画面) で設定した構成内容を XML で簡単に参照できるので、慣れないうちは画面で構成しながら確認 (作成) することもできます。
PowerShell を使った診断 (Diagnostics) の設定と変更
上述の通り、この診断構成 (WadCfg) を理解しておくと、Windows Powershell (コマンド) を使って細かな設定が可能です。例えば、診断 (IaaS Diagnostics Extension) が設定されていない VM に新規に診断を設定するには、下記の通り実行します。
# Login to Azure (ARM Mode)Login-AzureRMAccount# Set diagnostics for VM$conf = "c:\demo\wadcfg.xml"$sctx = New-AzureStorageContext -StorageAccountName "tsmatsuzteststorage" -StorageAccountKey "Weruxd/92v..."Set-AzureRmVMDiagnosticsExtension -ResourceGroupName "RG01" -VMName "testwin" -DiagnosticsConfigurationPath $conf -StorageContext $sctx -Location "East US" -Name "testdiag"上記の wadcfg.xml ファイルには、例えば、下記のような診断構成の XML を記述しておきます。 (ただし、下記の通り、XML 宣言なども含む完全な形にしておいてください。また、UTF-8 で保存してください。)
<?xml version="1.0" encoding="utf-8"?><PublicConfig xmlns="http://schemas.microsoft.com/ServiceHosting/2010/10/DiagnosticsConfiguration"> <WadCfg><DiagnosticMonitorConfiguration overallQuotaInMB="4096"> <WindowsEventLog scheduledTransferPeriod="PT1M"><DataSource name="System!*"/> </WindowsEventLog> <Metrics resourceId="/subscriptions/b3ae1c15-4fef-4362-8c3a-5d804cdeb18d/resourceGroups/RG01/providers/Microsoft.Compute/virtualMachines/testwin"><MetricAggregation scheduledTransferPeriod="PT1H"/><MetricAggregation scheduledTransferPeriod="PT1M"/> </Metrics></DiagnosticMonitorConfiguration> </WadCfg></PublicConfig>既に設定済の Diagnostics Extension の変更をおこなうには、下記の通り、いったん削除してから新規設定をおこなうと良いでしょう。(Name がわからない場合は、後述の Azure Resource Explorer などで確認できます。)
# Remove (incl. remove for replacement)Remove-AzureRmVMDiagnosticsExtension -ResourceGroupName "RG01" -VMName "testwin" -Name "Microsoft.Insights.VMDiagnosticsSettings"Resource template を使った構成
「Azure Resource Manager の template の How-to」で解説した Resource Template を使って Diagnostics Extension を構成するには、下記の通り記述します。
下記の xmlCfg には、上述の診断構成の XML の Base64 エンコード文字列を設定します。(下記の diagnosticsConf 変数の中身は省略して記載していますので注意してください。) json の中に XML が埋まっているというあまり見たくない構成ですが、我慢してください。。。
なお、上述の通り、この構成 (XML) そのものに Virtual Machine などの情報 (Subscription Id や Resource Group Name なども含む) が入っているので注意してください。つまり、実際の構成では、「Azure Resource Manager の template の How-to」で解説した Resource Template の関数を駆使して、動的に診断構成を生成することになります。(下記のサンプルでは、こうした処理を省略しています。)
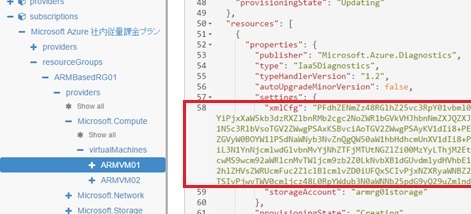
{ "$schema": "https://schema.management.azure.com/schemas/2015-01-01/deploymentTemplate.json#", "contentVersion": "1.0.0.0", "parameters": { }, "variables": {"diagnosticsConf": "<WadCfg><DiagnosticMonitorConfiguration overall... 前述参照" }, "resources": [{ "name": "testvnet", "type": "Microsoft.Network/virtualNetworks", "location": "East US", "apiVersion": "2015-06-15", "tags": {"displayName": "testvnet" }, "properties": {"addressSpace": { "addressPrefixes": ["10.0.0.0/16" ]},"subnets": [ {"name": "testsubnet","properties": { "addressPrefix": "10.0.0.0/24"} }] }},{ "name": "tsmatsuzteststorage", "type": "Microsoft.Storage/storageAccounts", "location": "East US", "apiVersion": "2015-06-15", "tags": {"displayName": "teststorage" }, "properties": {"accountType": "Standard_GRS" }},{ "apiVersion": "2015-06-15", "type": "Microsoft.Network/publicIPAddresses", "name": "testip", "location": "East US", "properties": {"publicIPAllocationMethod": "Dynamic","dnsSettings": { "domainNameLabel": "endpointtest"} }},{ "name": "testnic", "type": "Microsoft.Network/networkInterfaces", "location": "East US", "apiVersion": "2015-06-15", "dependsOn": ["Microsoft.Network/virtualNetworks/testvnet","Microsoft.Network/publicIPAddresses/testip" ], "tags": {"displayName": "testnic" }, "properties": {"ipConfigurations": [ {"name": "testipconfig","properties": { "privateIPAllocationMethod": "Dynamic", "subnet": {"id": "[concat(resourceId('Microsoft.Network/virtualNetworks', 'testvnet'), '/subnets/testsubnet')]" }, "publicIPAddress": {"id": "[resourceId('Microsoft.Network/publicIPAddresses', 'testip')]" }} }] }},{ "name": "testwin", "type": "Microsoft.Compute/virtualMachines", "location": "East US", "apiVersion": "2015-06-15", "dependsOn": ["Microsoft.Storage/storageAccounts/tsmatsuzteststorage","Microsoft.Network/networkInterfaces/testnic" ], "tags": {"displayName": "testwin" }, "properties": {"hardwareProfile": { "vmSize": "Basic_A1"},"osProfile": { "computername": "testwin", "adminUsername": "tsmatsuz", "adminPassword": "P@ssw0rd01"},"storageProfile": { "imageReference": {"publisher": "MicrosoftWindowsServer","offer": "WindowsServer","sku": "2012-R2-Datacenter","version": "latest" }, "osDisk": {"name": "testdisk","vhd": { "uri": "http://tsmatsuzteststorage.blob.core.windows.net/vhds/test.vhd"},"caching": "ReadWrite","createOption": "FromImage" }},"networkProfile": { "networkInterfaces": [{ "id": "[resourceId('Microsoft.Network/networkInterfaces', 'testnic')]"} ]} }, "resources": [{ "type": "extensions", "name": "testdiag", "apiVersion": "2015-06-15", "location": "East US", "dependsOn": ["Microsoft.Compute/virtualMachines/testwin" ], "properties": {"publisher": "Microsoft.Azure.Diagnostics","type": "IaaSDiagnostics","typeHandlerVersion": "1.4","autoUpgradeMinorVersion": true,"settings": { "xmlCfg": "[base64(variables('diagnosticsConf'))]", "StorageAccount": "tsmatsuzteststorage"},"protectedSettings": { "storageAccountName": "tsmatsuzteststorage", "storageAccountKey": "[listKeys(resourceId('Microsoft.Storage/storageAccounts', 'tsmatsuzteststorage'),'2015-06-15').key1]", "storageAccountEndPoint": "https://core.windows.net/"} }} ]} ], "outputs": { }}冒頭で Azure Portal (UI) を使って診断を構成しましたが、この診断構成 (XML) の結果は ARM の構成として記述されているので、Azure Resource Explorer などを使って確認することで、簡単に Base64 エンコードされた構成内容が確認できます (下図)。あとは、Base64 Decode すれば、XML による診断構成の内容が簡単に取り出せます。
また、ARM ベースの REST API を使って、プログラムなどから診断構成の設定や参照をおこなうこともできます。(ここでは Azure REST API の具体的利用方法の説明はおこないませんが、「Azure Resource (ARM) の REST API による管理」を参照してください。)
次回は、Linux 編を予定してます。
Categories: Uncategorized
