
For the last part of my blog series “Synapse Analytics : Designing for Performance”, here I’ll show you how you can use and accelerate performance with statistics and cache in Synapse Analytics SQL pool.
- Optimize for Distributions
- Choose Right Index and Partition
- How Statistics and Cache Works (this post)
As you can see in this post, managing these objects is subsidiary (not mandatory) for improving performance to design, however it’s sometimes required to explicitly tune up these properties, especially for mission-critical BI.
Statistics (Cost-based Optimization)
1. How Statistics Is Used ?
If you’re familiar with database management systems, you will know how important statistics is. Using statistics (“stats” for short), the database knows the cardinality of data (i.e, knows how the data is distributed) and it can then create the correct plan.
Let’s see how statistics is used with a simple example.
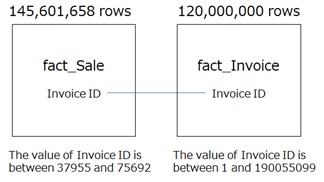
In this example, we assume the following 2 tables, fact_Sale and fact_Invoice.
Both these tables have [Invoice ID] column, however, these 2 columns in each tables have different distributions as follows. :
The range of [Invoice ID] values in fact_Sale is between 37955 and 75692. On contrary, the range of [Invoice ID] values in master table, fact_Invoice, is bewteen 1 and 190055099. We suppose that both values are evenly distributed in each tables.
Suppose, we don’t have any statistics on these tables. In this situation, let’s consider to run the following query, in which each table is joined by [Invoice ID] and filtered by [Invoice ID].
SELECT TOP(100) s.[Sale Key], i.[Customer Key]FROM [wwi].[fact_Invoice] i INNER JOIN [wwi].[fact_Sale] sON i.[Invoice ID] = s.[Invoice ID]WHERE i.[Invoice ID] >= 37955 AND i.[Invoice ID] <= 75692Note : As I’ll show you later, statistics will be automatically generated by default in Synapse Analytics.
In order to run query without statistics, run the following command to prevent automatic statistics creation, and use HEAP tables.ALTER DATABASE database01 SET AUTO_CREATE_STATISTICS OFF
To see the query plan (execution plan) for this query, let’s run as follows with EXPLAIN statement.
As you can see the result below, fact_Sale is filtered by [Invoice ID] and then the filtered result is all copied into all distributions (60 database).
As I have mentioned above, all rows (145,601,658 rows) in fact_Sale has [Invoice ID] values between 37955 and 75692. Then the filtered results has still 145,601,658 rows. As a result, large data will be copied into all distributions. (See my previous post “Azure Synapse Analytics : Optimize for Distributions” for details about distribution strategies.)
This plan is obviously inefficient and not performant. However, the database doesn’t know how the data (in [Invoice ID] column) is distributed, and cannot optimize the plan.
EXPLAINSELECT TOP(100) s.[Sale Key], i.[Customer Key]FROM [wwi].[fact_Invoice] i INNER JOIN [wwi].[fact_Sale] sON i.[Invoice ID] = s.[Invoice ID]WHERE i.[Invoice ID] >= 37955 AND i.[Invoice ID] <= 75692<?xml version="1.0" encoding="utf-8"?><dsql_query number_nodes="1" number_distributions="60" number_distributions_per_node="60"> <sql>SELECT TOP(100) s.[Sale Key], i.[Customer Key]FROM [wwi].[fact_Sale] s INNER JOIN [wwi].[fact_Invoice] iON s.[Invoice ID] = i.[Invoice ID]WHERE s.[Invoice ID] >= 37955 AND s.[Invoice ID] <= 75692</sql> <dsql_operations total_cost="37740.096" total_number_operations="5"><dsql_operation operation_type="RND_ID"> <identifier>TEMP_ID_10</identifier></dsql_operation><dsql_operation operation_type="ON"> <location permanent="false" distribution="AllComputeNodes" /> <sql_operations><sql_operation type="statement">CREATE TABLE [qtabledb].[dbo].[TEMP_ID_10] ([Sale Key] BIGINT NOT NULL, [Invoice ID] INT NOT NULL ) WITH(DISTRIBUTED_MOVE_FILE='');</sql_operation> </sql_operations></dsql_operation><dsql_operation operation_type="BROADCAST_MOVE"> <operation_cost cost="37740.096" accumulative_cost="37740.096" average_rowsize="12" output_rows="13104200" GroupNumber="12" /> <source_statement>SELECT [T1_1].[Sale Key] AS [Sale Key], [T1_1].[Invoice ID] AS [Invoice ID] FROM (SELECT [T2_1].[Sale Key] AS [Sale Key], [T2_1].[Invoice ID] AS [Invoice ID] FROM [WWI_test01].[wwi].[fact_Sale] AS T2_1 WHERE (([T2_1].[Invoice ID] >= CAST ((37955) AS INT)) AND ([T2_1].[Invoice ID] <= CAST ((75692) AS INT)))) AS T1_1OPTION (MAXDOP 1, MIN_GRANT_PERCENT = [MIN_GRANT], DISTRIBUTED_MOVE(N''))</source_statement> <destination_table>[TEMP_ID_10]</destination_table></dsql_operation><dsql_operation operation_type="RETURN"> <location distribution="AllDistributions" /> <select>SELECT [T1_1].[Sale Key] AS [Sale Key], [T1_1].[Customer Key] AS [Customer Key] FROM (SELECT TOP (CAST ((100) AS BIGINT)) [T2_2].[Sale Key] AS [Sale Key], [T2_1].[Customer Key] AS [Customer Key] FROM (SELECT [T3_1].[Invoice ID] AS [Invoice ID], [T3_1].[Customer Key] AS [Customer Key] FROM [WWI_test01].[wwi].[fact_Invoice] AS T3_1 WHERE (([T3_1].[Invoice ID] >= CAST ((37955) AS INT)) AND ([T3_1].[Invoice ID] <= CAST ((75692) AS INT)))) AS T2_1 INNER JOIN[qtabledb].[dbo].[TEMP_ID_10] AS T2_2ON ([T2_1].[Invoice ID] = [T2_2].[Invoice ID])) AS T1_1OPTION (MAXDOP 1, MIN_GRANT_PERCENT = [MIN_GRANT])</select></dsql_operation><dsql_operation operation_type="ON"> <location permanent="false" distribution="AllComputeNodes" /> <sql_operations><sql_operation type="statement">DROP TABLE [qtabledb].[dbo].[TEMP_ID_10]</sql_operation> </sql_operations></dsql_operation> </dsql_operations></dsql_query>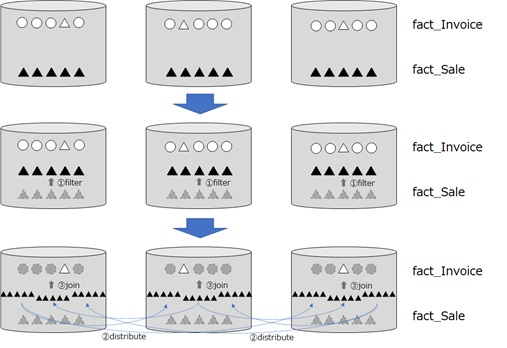
Now let’s create statistics for column [Invoice ID] in both fact_Sale and fact_Invoice tables as follows.
By creating these statistics, the database will know how the data of column [Invoice ID] is distributed in each tables.
CREATE STATISTICS [stat_seed_invoiceid] ON [wwi].[fact_Sale] ([Invoice ID]);CREATE STATISTICS [stat_invoice_invoiceid] ON [wwi].[fact_Invoice] ([Invoice ID]);Now let’s get the execution plan for the same query again !
In this new query plan, the data is filtered by using the column [Invoice ID] of fact_Invoice table, and the data will be significantly reduced compared with the previous plan. Eventually, the reduced data will be copied into all distributions.
This result might be the same as what you expect.
EXPLAINSELECT TOP(100) s.[Sale Key], i.[Customer Key]FROM [wwi].[fact_Invoice] i INNER JOIN [wwi].[fact_Sale] sON i.[Invoice ID] = s.[Invoice ID]WHERE i.[Invoice ID] >= 37955 AND i.[Invoice ID] <= 75692<?xml version="1.0" encoding="utf-8"?><dsql_query number_nodes="1" number_distributions="60" number_distributions_per_node="60"> <sql>SELECT TOP(100) s.[Sale Key], i.[Customer Key]FROM [wwi].[fact_Sale] s INNER JOIN [wwi].[fact_Invoice] iON s.[Invoice ID] = i.[Invoice ID]WHERE s.[Invoice ID] >= 37955 AND s.[Invoice ID] <= 75692</sql> <dsql_operations total_cost="56.048544" total_number_operations="5"><dsql_operation operation_type="RND_ID"> <identifier>TEMP_ID_15</identifier></dsql_operation><dsql_operation operation_type="ON"> <location permanent="false" distribution="AllComputeNodes" /> <sql_operations><sql_operation type="statement">CREATE TABLE [qtabledb].[dbo].[TEMP_ID_15] ([Invoice ID] BIGINT NOT NULL, [Customer Key] INT ) WITH(DISTRIBUTED_MOVE_FILE='');</sql_operation> </sql_operations></dsql_operation><dsql_operation operation_type="BROADCAST_MOVE"> <operation_cost cost="56.048544" accumulative_cost="56.048544" average_rowsize="12" output_rows="19461.3" GroupNumber="14" /> <source_statement>SELECT [T1_1].[Invoice ID] AS [Invoice ID], [T1_1].[Customer Key] AS [Customer Key] FROM (SELECT [T2_1].[Invoice ID] AS [Invoice ID], [T2_1].[Customer Key] AS [Customer Key] FROM [WWI_test01].[wwi].[fact_Invoice] AS T2_1 WHERE (([T2_1].[Invoice ID] >= CAST ((37955) AS INT)) AND ([T2_1].[Invoice ID] <= CAST ((75692) AS INT)))) AS T1_1OPTION (MAXDOP 1, MIN_GRANT_PERCENT = [MIN_GRANT], DISTRIBUTED_MOVE(N''))</source_statement> <destination_table>[TEMP_ID_15]</destination_table></dsql_operation><dsql_operation operation_type="RETURN"> <location distribution="AllDistributions" /> <select>SELECT [T1_1].[Sale Key] AS [Sale Key], [T1_1].[Customer Key] AS [Customer Key] FROM (SELECT TOP (CAST ((100) AS BIGINT)) [T2_2].[Sale Key] AS [Sale Key], [T2_1].[Customer Key] AS [Customer Key] FROM [qtabledb].[dbo].[TEMP_ID_15] AS T2_1 INNER JOIN(SELECT [T3_1].[Invoice ID] AS [Invoice ID], [T3_1].[Sale Key] AS [Sale Key] FROM [WWI_test01].[wwi].[fact_Sale] AS T3_1 WHERE (([T3_1].[Invoice ID] >= CAST ((37955) AS INT)) AND ([T3_1].[Invoice ID] <= CAST ((75692) AS INT)))) AS T2_2ON ([T2_1].[Invoice ID] = [T2_2].[Invoice ID])) AS T1_1OPTION (MAXDOP 1, MIN_GRANT_PERCENT = [MIN_GRANT])</select></dsql_operation><dsql_operation operation_type="ON"> <location permanent="false" distribution="AllComputeNodes" /> <sql_operations><sql_operation type="statement">DROP TABLE [qtabledb].[dbo].[TEMP_ID_15]</sql_operation> </sql_operations></dsql_operation> </dsql_operations></dsql_query>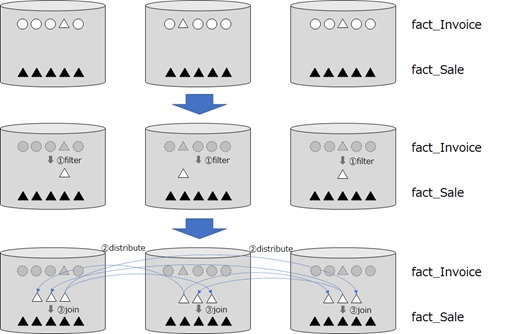
As you can see in above example, the statistics should be created on columns used in WHERE, JOIN, GROUP BY, ORDER BY or DISTINCT. (As I’ll show you later, the statistics will be automatically created by default in most cases.)
By running the following query, you can see which columns are having statistics. (In the following example, it shows all columns which has statistics in fact_Sale table.)
SELECT columns.name AS column_name, stats.name AS stats_nameFROM sys.stats_columnsJOIN sys.stats ON stats.object_id = stats_columns.object_idAND stats.stats_id = stats_columns.stats_idJOIN sys.columns ON stats_columns.object_id = columns.object_idAND stats_columns.column_id = columns.column_idWHERE stats_columns.object_id = OBJECT_ID('wwi.fact_Sale')column_namestats_name-----------------------------Invoice ID stat_seed_invoiceidDelivery Date Key stat_seed_deliverydateSale Key ClusteredIndex_b733765929c64c2493e9b19bb0f64c38City Key ClusteredIndex_b733765929c64c2493e9b19bb0f64c38Customer Key ClusteredIndex_b733765929c64c2493e9b19bb0f64c38...You can see the collected statistics with the following DBCC SHOW_STATISTICS command.
This result shows the histogram data of data cardinality.
DBCC SHOW_STATISTICS ('wwi.fact_Sale', 'stat_seed_deliverydate')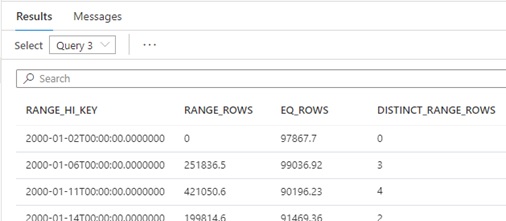
In the above result (see screenshot), it shows that :
- The estimated number of rows on upper boundary ‘2000-01-02’ is 97867.7. (See
EQ_ROWS.) - The estimated number of rows on upper boundary ‘2000-01-06’ is 99036.92. (See
EQ_ROWS.) - The estimated number of values on the range between ‘2000-01-02’ and ‘2000-01-06’ is 3, since there are ‘2000-01-03’, ‘2000-01-04’, and ‘2000-01-05’. (See
DISTINCT_RANGE_ROWS.)
And the estimated number of rows on this range is 251836.5. (SeeRANGE_ROWS.) - The estimated number of rows on upper boundary ‘2000-01-11’ is 90196.23. (See
EQ_ROWS.) - The estimated number of values on the range between ‘2000-01-06’ and ‘2000-01-11’ is 4, since there are ‘2000-01-07’, ‘2000-01-08’, ‘2000-01-09’ and ‘2000-01-10’. (See
DISTINCT_RANGE_ROWS.)
And the estimated number of rows on this range is 421050.6. (SeeRANGE_ROWS.)
By default, the database collects statistics by sampling data, not scanning full data. This default sampling rate is 20 % of rows, but you can reduce the ratio if data is so large. (In the official document, it says that it should be approximately 2 % when the data is more than 1 billion rows.)
You can explicitly set the ratio as follows.
CREATE STATISTICS [stat_seed_deliverydate] ON [wwi].[fact_Sale] ([Delivery Date Key]) WITH SAMPLE = 2 PERCENT;You can also create statistics on multiple columns (multi-column statistics) for the case of joining with multiple columns.
2. How Statistics Is Generated ?
By default, the statistics is automatically created, when it’s required.
Hence, in most cases, you don’t need to create statistics manually by yourself.
Note : When you check whether the automatic stats creation is enabled or not in your database, please run the following query.
SELECT name, is_auto_create_stats_on, is_auto_update_stats_on FROM sys.databasesname is_auto_create_stats_on is_auto_update_stats_on----------------------------------------------------------master True Truedatabase01 True FalseWhen you stop the automatic stats creation in your database, run as follows.
ALTER DATABASE database01 SET AUTO_CREATE_STATISTICS OFF
For instance, suppose we run the following query.
SELECT TOP(10) * FROM [wwi].[fact_Sale] WHERE [Delivery Date Key] = '2001-08-08';In this case, the following DDL will be executed in the database._WA_Sys_00000007_09746778 is the automatically created statistics name, which has the format of _WA_Sys_{8 digit column id in hex}_{8 digit table id in hex}.
CREATE STATISTICS [_WA_Sys_00000007_09746778] ON [wwi].[fact_Sale] ([Delivery Date Key]);Also, in the previous sales and invoice example, statistics of [Invoice ID] on both fact_Sale and fact_Invoice are automatically generated by default database settings. You don’t need nothing to do.
However, after the data is changed, you should update statistics if the cardinality is changed. Because the automatic update is not enabled in Synapse.
For instance, when you add (insert) new year’s history into fact_Sale table, the statistics of [Delivery Date Key] should be updated as follows.
UPDATE STATISTICS [wwi].[fact_Sale]([_WA_Sys_00000007_09746778]);Note : However, in “master” database, the automatic statistics update is enabled by default.
If the table is large, it will take a long time to create statistics on a table. For this reason, the first query running might be slow when it’s large table (such as, transaction tables or historical tables).
If you want to avoid this performance degradation, please run query (which will be run on production) once after the data is loaded, or ensure to create and update statistics manually after the data is changed.
Even if you could enable the automatic statistics update, the statistics will not be updated if the modified data is less than 20% of rows (when the number of existing rows is more than 500).
When you want to ensure to keep statistics up-to-date, it will be recommended to create and manage statistics manually.
I also note that the index columns in clustered/non-clustered rowstore indexes and all columns in columnstore tables has its own statistics, even when the automatic statistics creation is disabled. (Unlike user-generated statistics, these statistics will show null by DBCC SHOW_STATISTICS command.)
Note : To update these statistics in indexes, please use
ALTER INDEXcommand.
Caching
As I mentioned in my previous post “Azure Synapse Analytics : Optimize for Distributions“, the replicate table will also copy tables and generate indexes on all distributed database in the first query running. (Note that this is not temporary (not caching) and persisted on database.)
In Synapse Analytics, a lot of database objects (such as, compiled procedure, plan, …) will also be cached in some conditions on query. For instance, CCI tables (see my previous post “Azure Synapse Analytics : Choose Right Index and Partition” for CCI) will locally cache the recently-used columnstore segments on distributed node, which is called columnar cache.
These objects (which will be cached) will become so large to fit in-memory. To keep performant cache, NVMe SSD (called adaptive cache) is working in underlying Gen2 architecture. NVMe SSD is less performant than in-memory, but significantly performant than disk storage, and its capacity is enough to cache these required data. Synapse binary is aware of data-processing parallelism by hardware trends of NVMe SSD. (See team’s blog “Adaptive caching powers Azure SQL Data Warehouse performance gains” for underlying architecture which improves caching in Gen2.)
You cannot manually control these caching activities and these are automatically applied to improve performance in Synapse Analytics. All you have to do is “just use Synapse Analytics”.
Not only database objects, but you can also cache the results of query. It’s called result set caching.
This cache can be operated (manipulated) by developers.
By default, the result set caching is disabled in the database. (See below.)
SELECT name, is_result_set_caching_on FROM sys.databasesname is_result_set_caching_on-----------------------------------master Falsedatabase01 FalseWhen the result set caching is turned on in your database (see below), the query result will be cached in the first query running. If the same query is invoked in database, the database fetches the cached results and the query computation is not executed. This might reduce the latency for query.
ALTER DATABASE database01 SET RESULT_SET_CACHING ON;Suppose, you run the following query on database with result set caching enabled.
SELECT [Sale Key]FROM [wwi].[fact_Sale]WHERE [Delivery Date Key] >= '2002-01-10' AND [Delivery Date Key] <= '2002-01-13'After the query is completed, see how it’s planned using sys.dm_pdw_request_steps as follows.
You will find that the result is fetched from the cached result, [DWResultCacheDb].dbo.[iq_{131EB31D-5E71-48BA-8532-D22805BEED7F}]. (See below.)
When you run the same query again, this cache will be reused and the original query is no longer executed.
SELECT request_id, step_index, commandFROM sys.dm_pdw_request_stepsrequest_id step_index command-------------------------------...QID469 0 SELECT [T1_1].[Sale Key] AS [Sale Key] FROM (SELECT [T2_1].[Sale Key] AS [Sale Key] FROM [WWI_test01].[wwi].[fact_Sale] AS T2_1 WHERE (([T2_1].[Delivery Date Key] >= CAST ('01-10-2002' AS DATE)) AND ([T2_1].[Delivery Date Key] <= CAST ('01-13-2002' AS DATE)))) AS T1_1 OPTION (MAXDOP 1, MIN_GRANT_PERCENT = [MIN_GRANT], DISTRIBUTED_MOVE(N''), MAX_GRANT_PERCENT = [MAX_GRANT])QID469 1 select * from [DWResultCacheDb].dbo.[iq_{131EB31D-5E71-48BA-8532-D22805BEED7F}] OPTION(MAXDOP 1)...Suppose, we have now changed the query as follows.
In the following query, I have just changed the order of WHERE conditions. Obviously, this query has the same meaning as previous query. (The query result is exactly the same.)
SELECT [Sale Key]FROM [wwi].[fact_Sale]WHERE [Delivery Date Key] <= '2002-01-13' AND [Delivery Date Key] >= '2002-01-10'However, at this time, another result set, [DWResultCacheDb].dbo.[iq_{687AB5A6-F01C-457D-B562-09CCB3A81AB3}], is cached and used. (See below.)
In order to use the same cached result, there should be the exact matching between the original query and the new query. Even when you have inserted only one space character in the string of query, then the cached result will not be used.
SELECT request_id, step_index, commandFROM sys.dm_pdw_request_stepsrequest_id step_index command-------------------------------...QID716 0 SELECT [T1_1].[Sale Key] AS [Sale Key] FROM (SELECT [T2_1].[Sale Key] AS [Sale Key] FROM [WWI_test01].[wwi].[fact_Sale] AS T2_1 WHERE (([T2_1].[Delivery Date Key] >= CAST ('01-10-2002' AS DATE)) AND ([T2_1].[Delivery Date Key] <= CAST ('01-13-2002' AS DATE)))) AS T1_1 OPTION (MAXDOP 1, MIN_GRANT_PERCENT = [MIN_GRANT], DISTRIBUTED_MOVE(N''), MAX_GRANT_PERCENT = [MAX_GRANT])QID716 1 select * from [DWResultCacheDb].dbo.[iq_{687AB5A6-F01C-457D-B562-09CCB3A81AB3}] OPTION(MAXDOP 1)...Of course, the cached results don’t persist permanently. The cached results reside until the cache is full. The maximum size of result set cache is 1 TB per database.
In order to see the size used for cached results, run the following DBCC command. In the following example, 15496 – 936 = 14560 KB is used for cached results. The value of RESERVED_SPACE will be increased every time new cached result is added. (However, the large result more than 10 GB will not be cached.)
The cache eviction is managed by Synapse Analytics dedicated SQL pool based on “time-aware least recently used” (TLRU) algorithm.
DBCC SHOWRESULTCACHESPACEUSEDRESERVED_SPACE DATA_SPACE INDEX_SPACE UNUSED_SPACE15496 13048 1512 936Note : The cached result is managed in remote database. Therefore the cached result will not be removed by pause/resume on database.
When you have changed data in source table, the cached result is invalidated and refreshed. (The new cached result will be generated again on the first query.)
The cache is shared by all users (scopes) in the same database, then the cached result will not be used when RLS (row-level security) or CLS (column-level security) is used in source table.
There also exist other conditions, in which the result set caching is not available. See the official document “Synapse Analytics : Performance tuning with result set caching” for details.
As you saw above, the result set caching can be turned on for entire database. You cannot turn on for specific tables or queries. When you want to cache results for some specific complicated queries, please consider using a materialized view instead.
As we saw in my previous post “Azure Synapse Analytics : Optimize for Distributions“, a materialized view will pre-compute, store, and maintain its data along with the query definition. (The definition in a materialized view should include aggregate functions or GROUP BY clause.)
In this series, I’ve showed you well-known patterns and considerations for designing schema in Synapse Analytics dedicated SQL pool.
Of course, it’s important for performance by improving parallelism to assign right size of data warehouse units (DWU). You can also improve performance by managing workload properties, such as, workload importance (priorities) or resource allocations. For instance, it will be available, when you separate the workloads between user’s query and backend loading. The right SQL is also important for performance : for instance, fetching too many rows or too many columns will also cause the degradation of performance. You can also set query hints in your query.
However, I didn’t describe these things in this series, since it’s so far from “schema designing” (or schema implementation).
Please refer the official document for workload management, or some other topics.
As I described in my first post of this series, Synapse Analytics will outperform compared with other analytics database and meet your needs, if you implement schema with right choice.
Useful Reference :
Cheat sheet for Azure Synapse Analytics
https://docs.microsoft.com/en-us/azure/synapse-analytics/sql-data-warehouse/cheat-sheet
Best practices for Azure Synapse Analytics
https://docs.microsoft.com/en-us/azure/synapse-analytics/sql-data-warehouse/sql-data-warehouse-best-practices
Categories: Uncategorized

3 replies»