
In Apache Spark, your code is translated into each stage and jobs for distribution and optimization. For instance, when you join 2 tables, in which one is small and the other is large, the small one will be broadcasted to all executors. When both are large, it will be hashed into executors and combined in parallel.
You can see these execution plan (by explain() ) and hint in your code for performance optimization.
Note : In recent Spark, the plan (before execution) might differ in execution time by Adaptive Query Execution (AQE), with which the plan will be optimized in execution. You can also see these difference of plans (initial plan and final plan).
In Apache Spark 3.2, AQE is enabled by default.
When you have encountered the performance degradation, you should identify the bottlenecks in your code. In Apache Spark, you can use the detailed logs or monitoring API (REST API) for this purpose.
By the integration with your Notebook experience, sparkMeasure simplifies these works for logging, monitoring and analyzing in Apache Spark.
In this post, I briefly show you how to use this package in your Notebook.
Here, I used Azure Databricks for Apache Spark cluster.
Please install the following packages in your cluster.
- Install
ch.cern.sparkmeasure:spark-measure_2.11:0.15from Maven repository
(See appropriate version in Maven repository.) - Install
sparkMeasure(pyspark wrapper package) with PyPI
Job, Stage, and Task
Before starting, let me briefly explain about Job, Stage, and Task in Apache Spark.
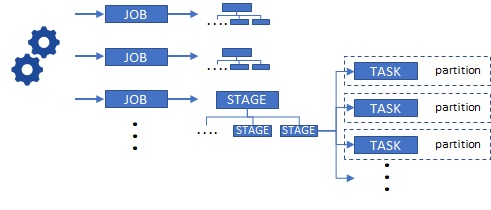
First of all, when you request some work in Apache Spark (such as, submitting an application or running in notebook), Spark Jobs are submitted. Job is the start point for the distributed execution in Spark.
Each job includes several physical executions called Stages. Then each Stage runs multiple Tasks, which are the real execution units corresponding to each Spark partitions of RDD.
Here I illustrate this outline image as below.
Understanding these terminologies is important for seeing results in metrics.
Ease of Measurement by “sparkMeasure”
In this post I measure the following line of code, which loads 420 MB data from CSV file and generates Spark dataframe. (Please see here for the original notebook.)
df = (sqlContext.read.format("csv"). option("header", "true"). option("nullValue", "NA"). option("inferSchema", True). load("abfss://container01@demostore01.dfs.core.windows.net/flight_weather.csv"))First we measure “Stage” metrics as follows.
For measuring Stage metrics, please create sparkmeasure.StageMetrics for preparation.
from sparkmeasure import StageMetricsmetricStage = StageMetrics(spark)
Now we measure the previous code using runandmeasure() method.
With this method, the specified code (2nd argument in runandmeasure() below) goes into run in this context, and it is measured and metrics are collected.
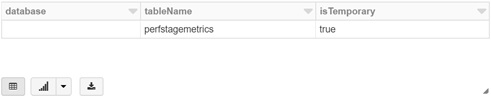
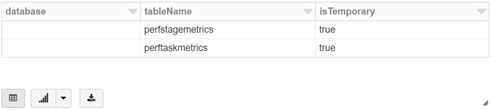
metricStage.runandmeasure( locals(), 'df = sqlContext.read.format("csv").option("header", "true").option("nullValue", "NA").option("inferSchema", True).load("abfss://container01@demostore01.dfs.core.windows.net/flight_weather.csv")')After the measurement, you can find the temporary table named “perfstagemetrics”. (This table is temporary and then it will be evaporated when you restart your cluster.)
%sqlshow tables
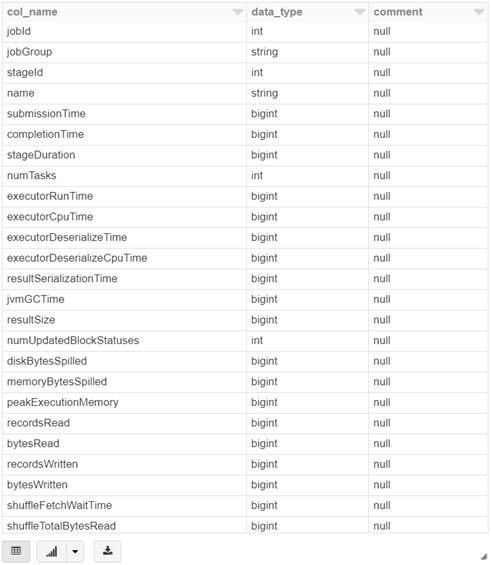
Now let’s see the schema of “perfstagemetrics” table. You will find a lot of metrics in this table as below.
%sqldesc formatted perfstagemetrics
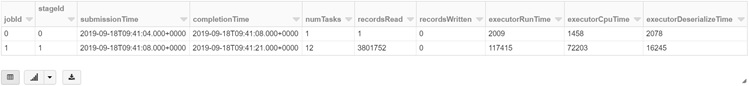
Here we see the metric results with following columns.
You will find that there exist 2 jobs and corresponding 2 stages, in which stage 0 (stageId=0) is some kind of provisioning task and stage 1 (stageId=1) includes main loading tasks.
%sqlselectjobId,stageId,timestamp(from_unixtime(submissionTime/1000,'yyyy-MM-dd HH:mm:ss')) as submissionTime,timestamp(from_unixtime(completionTime/1000,'yyyy-MM-dd HH:mm:ss')) as completionTime,numTasks,recordsRead,recordsWritten,executorRunTime,executorCpuTime,executorDeserializeTimefrom perfstagemetrics
Now let’s go into details. Next we measure “Task” metrics as follows.
Same as “Stage” metrics, you create sparkmeasure.TaskMetrics and run runandmeasure() for the target code.
from sparkmeasure import TaskMetricsmetricTask = TaskMetrics(spark)metricTask.runandmeasure( locals(), 'df = sqlContext.read.format("csv").option("header", "true").option("nullValue", "NA").option("inferSchema", True).load("abfss://container01@demostore01.dfs.core.windows.net/flight_weather.csv")')After completion, you will find another temporary table named “perftaskmetrics” with the following columns.
%sqlshow tables
%sqldesc formatted perftaskmetrics
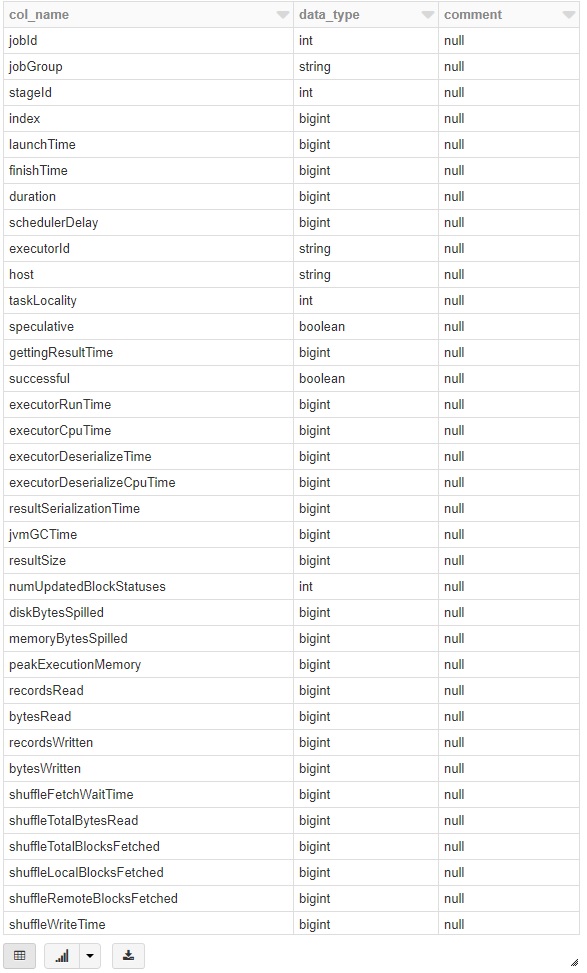
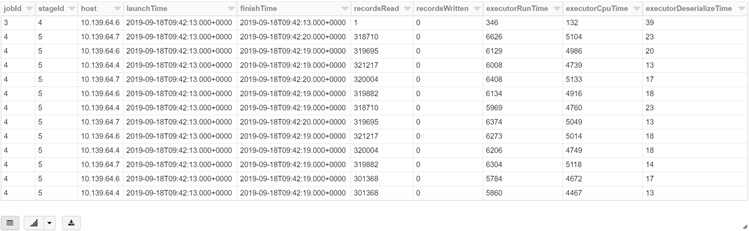
Let’s see the metric results with the following columns here.
You can easily find that all rows are eventually separated by each tasks (each has 320,000 rows) in parallel and it takes around 6000 ms for loading in each task.
%sqlselectjobId,stageId,host,timestamp(from_unixtime(launchTime/1000,'yyyy-MM-dd HH:mm:ss')) as launchTime,timestamp(from_unixtime(finishTime/1000,'yyyy-MM-dd HH:mm:ss')) as finishTime,recordsRead,recordsWritten,executorRunTime,executorCpuTime,executorDeserializeTimefrom perftaskmetricsorder by index
Iterating Works with Cause Analysis …
Since you can see the metrics without going outside your notebook, it helps you immediately identify which line is the bottleneck.
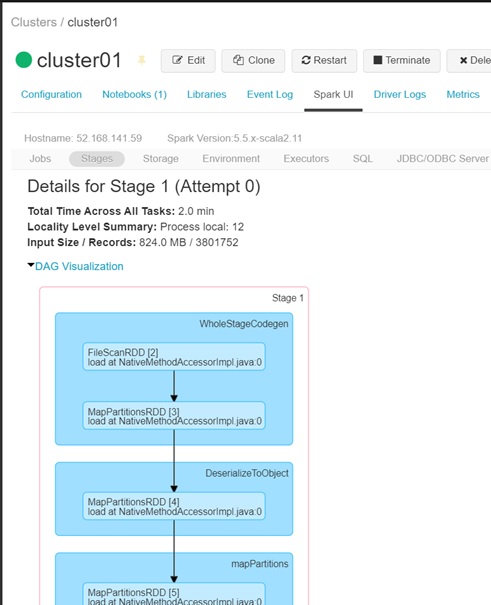
After you’ve identified stage or task for bottlenecks, you will be able to look for the root causes using Spark UI for execution plans (see below) or Ganglia metrics for insufficient resource consumption (RAM, CPU, and so on).
Once you’ve identified the root causes and improved, you can also soon check how it affects for the performance using sparkMeasure again.
This work will be repeated during your experimentation…
Spark UI
Ganglia UI

Reference :
GitHub – sparkMeasure
https://github.com/LucaCanali/sparkMeasure
Categories: Uncategorized

1 reply»