
This post explains the Application Insights using API and SDK. By seeing with APIs, it helps you to understand what you can do or cannot do with Application Insights, and how to leverage the Application Insights in your applications.
Azure Application Insights collects the application events (exceptions, requests, page views, etc), and you can view or analyze that data.
If you are familiar with the event tracing in Windows, you will find that Application Insights is the similar one for the cloud-based platform. But, unlike Windows event tracing, it’s open and cross-platform (not only for Windows or .NET), and you can leverage, even if it’s on the on-premise or other cloud platforms. (Please see “Application Insights – Developer analytics: languages, platforms, and integrations“.)
Note : Windows event log (including system log) and performance data itself on Azure VM can also be sent to Application Insights, and you can see these data in one view. (In most cases, these telemetry is sent to the Azure Table by Azure diagnostics extensions.)
Note (Added on Sep 2018) : Now you can submit custom metrics in Azure Monitor (instead of Azure Application Insights) and view collected data for any Azure resource in one view. (See announcement “A new way to send custom metrics to Azure Monitor“.)
In general you can use the Application Insights with no additional code and programming by your own (the SDK does all), but here we use the Application Insights by custom code and see how it works behind the scenes for your understanding.
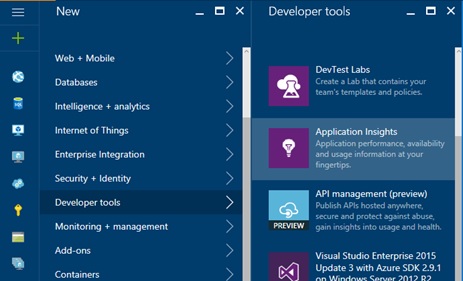
Before starting, please create the Application Insights resource in Azure Portal. (select [+New] – [Developer tools] – [Application Insights] in the portal)
Sending telemetry
First we send the simple custom event by a bit of programming code with Application Insights SDK.
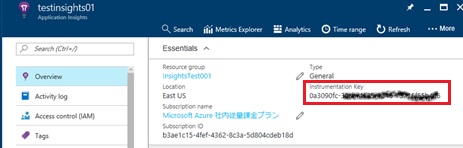
Before using SDK, please get the instrumentation key in Azure Portal. (You need this key for sending the telemetry.)
Here we create the console application using C#, and we use only the Application Insights core library (Microsoft.ApplicationInsights.dll). Then you must install only “Microsoft.ApplicationInsights” nuget package in your console application.
First we create the following code. Please use your own api key as the following instrumentation key.
By this code, the telemetry data is sent to dc.services.visualstudio.com (using the json format) and stored.
...using Microsoft.ApplicationInsights;using Microsoft.ApplicationInsights.Extensibility;...static void Main(string[] args){ TelemetryConfiguration.Active.InstrumentationKey ="0a3090fc-..."; // you must set your own instrumentation key TelemetryConfiguration.Active.TelemetryChannel.DeveloperMode= true; // see the following note TelemetryClient cl = new TelemetryClient(); cl.TrackEvent("TestEvent01"); cl.Flush(); Console.WriteLine("Done"); Console.ReadLine();}Note : If you set true as DeveloperMode (see above), you can see the sending telemetry in the debugging output window in IDE. (You should run the code as debugging.)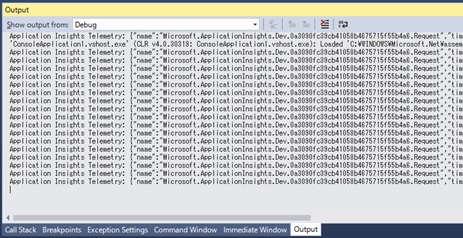
Note : Your app can also instrument at run time without SDK. (Here I don’t describe about this settings and steps.)
Application Insights SDK is doing several tasks internally and encapsulates the difficulties.
For example, the telemetry sending is done with low overheads using non-blocking and threading.
In this Windows console app, the telemetry is sent by the Windows event tracing mechanism (ETW), i.e, by the event source and the event listener. Eventually, by non-blocking and threading of this mechanism, the overheads of your application’s performance makes very low.
For this reason, it’s not recommended that you directly call the rest endpoint for sending the telemetry, and it’s better to use the Application Insights SDK for sending the telemetry.
The server also responds soon, and the subsequent steps will be done in the server side by asynchronously after the acceptance.
Here we’re now programming with .NET class of Application Insights and manually provisioning. But, in the most cases, this task will be done by some sort of the injection mechanism.
For the .NET Fx applications (including this application), if ApplicationInsights.config file exists in your project, all these instances (assemblies) are dynamically created from the ApplicationInsights.config when TelemetryConfiguration.Active method is called. Moreover this method (TelemetryConfiguration.Active) is caused by the custom http module in the web.config. That is, the config settings does these all tasks, and no need to create the code by your own. (The SDK automatically injects the config settings. You can also customize the default configuration by editing ApplicationInsights.config or Global.asax.)
Getting the collected data (Events)
After you send the telemetry, you can see and search (or analyze) the collected data in Azure Portal or Visual Studio. (It takes several minutes to appear. Sorry, but be patient !)
Using Visual Studio, you can also check the several advanced metrics on Application Insights with load testing.
Like existing Azure Monitor REST API, you can also access Application Insights data using your custom code, and in this post, we see the collected data by this rest api called Application Insights REST API without UI. (Note that this endpoint is not for sending telemetry which I previously explained. This is for getting events and metrics.)
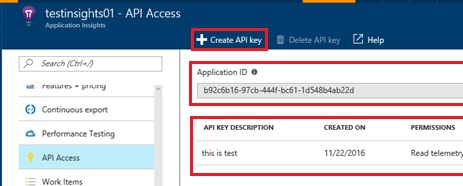
Before using this REST API, first you must get the application id (app id) and create the api key in Azure Portal. (Note that this is not the previous instrumentation key.)
Later I show you the rest api’s raw data, but using following api explorer you don’t need to create your code and check the results soon. (You just set the application id and api key in this api explorer, and done !)
Application Insights REST API Explorer
https://dev.applicationinsights.io/apiexplorer/
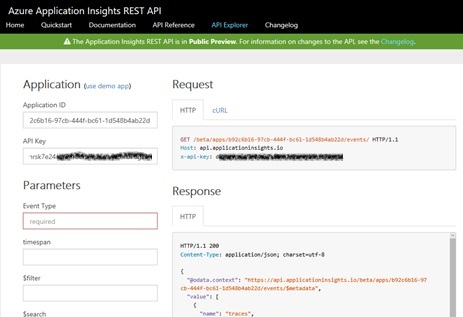
For example, next is retrieving the events in Application Insights resource. Note that the data is returned for last 12 hours by default. (Later I show you how to retrieve more data in the past.)
GET https://api.applicationinsights.io/beta/apps/{app id}/events/Accept: application/jsonX-API-Key: {api key}HTTP/1.1 200 OKAccess-Control-Allow-Origin: *Content-Type: application/json; charset=utf-8; ieee754compatible=false; odata.metadata=none; odata.streaming=falseOData-Version: 4.0;{ "@odata.context": "https://api.applicationinsights.io/beta/apps/{app id}/events/$metadata#Collection(Edm.EntityType)", "@ai.messages": [{ "code": "AddedLimitToQuery", "message": "The query was limited to 500 rows"} ], "value": [{ "id": "eb54a650-b0a3-11e6-99bb-39d55d240b8a", "type": "customEvent", "count": 1, "timestamp": "2016-11-22T11:07:54.770Z", "customDimensions": {"DeveloperMode": "true" }, "customMeasurements": null, "operation": {"name": null,"id": "","parentId": "","syntheticSource": null }, "session": {"id": null }, "user": {"id": null,"accountId": null,"authenticatedId": null }, "cloud": {"roleName": null,"roleInstance": null }, "ai": {"iKey": "0a3090fc-...","appName": "testinsights01","appId": "{app id}","sdkVersion": "dotnet: 2.1.0.26048" }, "customEvent": {"name": "TestEvent01" }, "application": {"version": null }, "client": {"model": null,"os": null,"type": "PC","browser": null,"ip": "167.220.232.0","city": null,"stateOrProvince": null,"countryOrRegion": "Japan" }},... ]}All built-in events (customEvents, exceptions, traces, requests, pageViews, dependencies, etc) inherits this “event”, and you can narrow by the event type like /events/customEvents as follows.
GET https://api.applicationinsights.io/beta/apps/{app id}/events/customEventsAccept: application/jsonX-API-Key: {api key}You can use the OData expression. ($filter, $orderBy, $search, $apply, $top, $skip and $format is supported.)
For instance, if you want to get more data in the past, you can specify the timestamp condition as follows. The following example retrieves data for last 5 days.
(“timestamp%20gt%20now()%20sub%20duration%27P5D%27” is the url-encoded string of “timestamp gt now() sub duration'P5D'“.)
GET https://api.applicationinsights.io/beta/apps/{app id}/events/$all?$filter=timestamp%20gt%20now()%20sub%20duration%27P5D%27Accept: application/jsonX-API-Key: {api key}Note : The data has its retention (up to 90 days), and if you want to keep the data, please use the continuous export. (see “Data collection, retention and storage in Application Insights” for details.) You cannot also delete the data on purpose. (The retention is automatically determined by the Application Insights.)
Now let’s say your application is adding some custom properties as follows.
static void Main(string[] args){ TelemetryConfiguration.Active.InstrumentationKey = "0a3090fc-..."; TelemetryConfiguration.Active.TelemetryChannel.DeveloperMode = true; TelemetryClient cl = new TelemetryClient(); var props = new Dictionary{{ "importance", "high"},{ "difficulty", "C"}}; cl.TrackEvent("TestEvent01", props); cl.Flush(); Console.WriteLine("Done"); Console.ReadLine();}Then you can also filter using this custom properties. See the following example.
GET https://api.applicationinsights.io/beta/apps/{app id}/events/customEvents?$filter=customDimensions%2Fimportance%20eq%20%27high%27Accept: application/jsonX-API-Key: {api key}HTTP/1.1 200 OKAccess-Control-Allow-Origin: *Content-Type: application/json; charset=utf-8; ieee754compatible=false; odata.metadata=none; odata.streaming=falseOData-Version: 4.0;{ "@odata.context": "https://api.applicationinsights.io/beta/apps/{app id}/events/$metadata#customEvents", "@ai.messages": [{ "code": "AddedLimitToQuery", "message": "The query was limited to last 12 hours, since no other limit for timestamp field was specified"},{ "code": "AddedLimitToQuery", "message": "The query was limited to 500 rows"} ], "value": [{ "id": "2f312141-b2c1-11e6-a5fd-f381db5f52d8", "type": "customEvent", "count": 1, "timestamp": "2016-11-25T03:42:22.938Z", "customDimensions": {"DeveloperMode": "true","difficulty": "C","importance": "high" }, "customMeasurements": null, "operation": {"name": null,"id": null,"parentId": null,"syntheticSource": null }, "session": {"id": null }, "user": {"id": null,"accountId": null,"authenticatedId": null }, "cloud": {"roleName": null,"roleInstance": null }, "ai": {"iKey": "0a3090fc-...","appName": "testinsights01","appId": "{app id}","sdkVersion": "dotnet: 2.1.0.26048" }, "customEvent": {"name": "TestEvent01" }, "application": {"version": null }, "client": {"model": null,"os": null,"type": "PC","browser": null,"ip": "167.220.232.0","city": null,"stateOrProvince": null,"countryOrRegion": "Japan" }} ]}Metrics
Let’s see about metrics.
First you can check what kind of metrics is supported for each data types using the metadata endpoint.
The following is the returned result of the metadata. This shows a list of supported metrics in Application Insights.
It’s very long result, and here I’m cutting the latter parts.
GET https://api.applicationinsights.io/beta/apps/{app id}/metrics/metadataAccept: application/jsonX-API-Key: {api key}{ "metrics": {"requests/count": { "supportedAggregations": ["sum" ], "displayName": "Server requests", "supportedGroupBy": {"all": [ "request/name", "request/urlPath", "request/urlHost", "request/success", "request/resultCode", "request/performanceBucket", "operation/name", "operation/synthetic", "user/authenticated", "application/version", "client/type", "client/model", "client/os", "client/city", "client/stateOrProvince", "client/countryOrRegion", "client/browser", "cloud/roleName", "cloud/roleInstance"] }, "defaultAggregation": "sum"},"requests/duration": { "supportedAggregations": ["avg","min","max","sum","count" ], "displayName": "Server response time", "units": "ms", "supportedGroupBy": {"all": [ "request/name", "request/urlPath", "request/urlHost", "request/success", "request/resultCode", "request/performanceBucket", "operation/name", "operation/synthetic", "user/authenticated", "application/version", "client/type", "client/model", "client/os", "client/city", "client/stateOrProvince", "client/countryOrRegion", "client/browser", "cloud/roleName", "cloud/roleInstance"] }, "defaultAggregation": "avg"},"requests/failed": { ...},"pageViews/count": { ...},"pageViews/duration": { ...},"customEvents/count": { ...},"dependencies/count": { ...},"dependencies/failed": { ...},"dependencies/duration": { ...},"exceptions/count": { ...},"exceptions/browser": { ...},"exceptions/server": { ...},"performanceCounters/requestExecutionTime": { ...},"performanceCounters/requestsPerSecond": { ...},"performanceCounters/requestsInQueue": { ...},"performanceCounters/memoryAvailableBytes": { ...},"performanceCounters/exceptionsPerSecond": { ...},"performanceCounters/processCpuPercentage": { ...},"performanceCounters/processIOBytesPerSecond": { ...},"performanceCounters/processPrivateBytes": { ...},"performanceCounters/processorCpuPercentage": { ...},"traces/count": { ...},... }, "dimensions": {... }}Note : “Dependency” is the tracking telemetry of the calls between your application components (a HTTP service, a database, or a file system). Using this data, Application Insights service in Azure Portal can display the map (diagram) of your application components.
Now I show you the example of “requests/duration” metric.
The “duration” is the time span between start time and end time, and the telemetry like “request” or “pageView” is having this property.
Let’s say we send the “request” telemetry as follows. This code is sending the telemetry periodically (each seconds), and it’s having the various duration values between 5 seconds (5,000 millisec) to 15 seconds (15,000 millisec).
Note : As I described before, this is usually done by the http module injected by the Application Insights SDK when using ASP.NET. (The programmers don’t have to write this code in most cases.)
...using Microsoft.ApplicationInsights.DataContracts;...static void Main(string[] args){ TelemetryConfiguration.Active.InstrumentationKey = "0a3090fc-..."; TelemetryConfiguration.Active.TelemetryChannel.DeveloperMode = true; TelemetryClient cl = new TelemetryClient(); // Sending Request telemetry int lag = 0; while(true) {RequestTelemetry telemetry = new RequestTelemetry( "test-request", // request name DateTimeOffset.Now, // start time new TimeSpan(0, 0, 5 + lag), // duration "OK", // status true); // success or failure// You can also write as follows//RequestTelemetry telemetry = new RequestTelemetry();//telemetry.Id = Guid.NewGuid().ToString();//telemetry.Name = "test-request";//telemetry.Start();//System.Threading.Thread.Sleep((5 + lag) * 1000);//telemetry.Stop();cl.TrackRequest(telemetry);System.Threading.Thread.Sleep(1000);lag = (lag == 10 ? 0 : lag + 1); }}As you can see in the previous metadata, “requests/duration” supports the aggregation operations of “avg” (average), “min” (minimum), “max” (maximum), “sum”, and “count”.
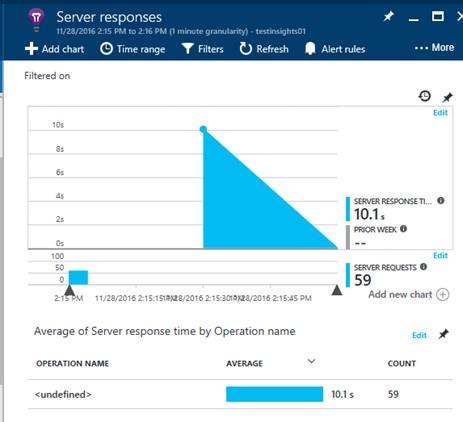
The following is requesting the metrics of minimum, maximum, and average duration from 2016-11-28T04:55:00Z till 2016-11-28T04:56:00Z.
As you can guess, the result of minimum duration is 5,000 millisec, the maximun duration is 15,000, and the average duration is around 10,000.
GET https://api.applicationinsights.io/beta/apps/{app id}/metrics/requests/duration?timespan=2016-11-28T04%3A55%3A00Z%2F2016-11-28T04%3A56%3A00Z&aggregation=min%2Cmax%2CavgAccept: application/jsonX-API-Key: {api key}HTTP/1.1 200 OKAccess-Control-Allow-Origin: *Content-Type: application/json; charset=utf-8{ "value": {"start": "2016-11-28T04:55:00.000Z","end": "2016-11-28T04:56:00.000Z","requests/duration": { "min": 5000, "max": 15000, "avg": 9830.51} }}You can also request using the following format.
// Requesting the result from 2016-11-28T05:00:00Z for 1 hour (from 05:00:00 to 06:00:00)GET https://api.applicationinsights.io/beta/apps/{app id}/metrics/requests/duration?timespan=2016-11-28T05%3A00%3A00Z%2FPT1H&aggregation=min%2Cmax%2Cavg// Requesting the result past 1 hourGET https://api.applicationinsights.io/beta/apps/{app id}/metrics/requests/duration?timespan=PT1H&aggregation=min%2Cmax%2CavgIf you skip the parameters, the default value is used.
For instance, the following is requesting the average (avg) value past 12 hours. Because the “defaultAggregation” in the metadata is “avg”.
GET https://api.applicationinsights.io/beta/apps/{app id}/metrics/requests/durationAccept: application/jsonX-API-Key: {api key}HTTP/1.1 200 OKAccess-Control-Allow-Origin: *Content-Type: application/json; charset=utf-8{ "value": {"start": "2016-11-27T18:00:01.002Z","end": "2016-11-28T06:00:01.002Z","requests/duration": { "avg": 10000.88} }}Using “interval” property, you can see the transition of the aggregated metrics in the specific timeline.
For instance, the following returns the results of each one minute from 2016-11-28T05:00:00Z till 2016-11-28T06:00:00Z (one hour long). This returns 60 elements of data.
GET https://api.applicationinsights.io/beta/apps/{app id}/metrics/requests/duration?timespan=2016-11-28T05%3A00%3A00Z%2F2016-11-28T06%3A00%3A00Z&interval=PT1M&aggregation=min%2Cmax%2CavgAccept: application/jsonX-API-Key: {api key}HTTP/1.1 200 OKAccess-Control-Allow-Origin: *Content-Type: application/json; charset=utf-8{ "value": {"start": "2016-11-28T05:00:00.000Z","end": "2016-11-28T06:00:00.000Z","interval": "PT1M","segments": [ {"start": "2016-11-28T05:00:00.000Z","end": "2016-11-28T05:01:00.000Z","requests/duration": { "min": 5000, "max": 15000, "avg": 9881.36} }, {"start": "2016-11-28T05:01:00.000Z","end": "2016-11-28T05:02:00.000Z","requests/duration": { "min": 5000, "max": 15000, "avg": 9966.1} }, {"start": "2016-11-28T05:02:00.000Z","end": "2016-11-28T05:03:00.000Z","requests/duration": { "min": 5000, "max": 15000, "avg": 10237.29} }, ...] }}Using this way, you could draw the transition graphs in your application like same as the graphs in Azure Portal.
Using Application Insights in Azure Portal, you can also set the webhook for some threshold of metrics.
Query
You can use the advanced analytics query for the telemetry data. Let’s see the simple example.
Now here we send the “pageView” telemetry as follows.
static void Main(string[] args){ TelemetryConfiguration.Active.InstrumentationKey = "0a3090fc-..."; TelemetryConfiguration.Active.TelemetryChannel.DeveloperMode = true; TelemetryClient cl = new TelemetryClient(); // Sending Page View telemetry Random rnd = new Random(); while (true) {cl.TrackPageView($"test{rnd.Next(10)}.htm");System.Threading.Thread.Sleep(1000); }}Let me show the top 3 pages of the most page views using the analytics query. This time, first we see the UI in the analytics portal.
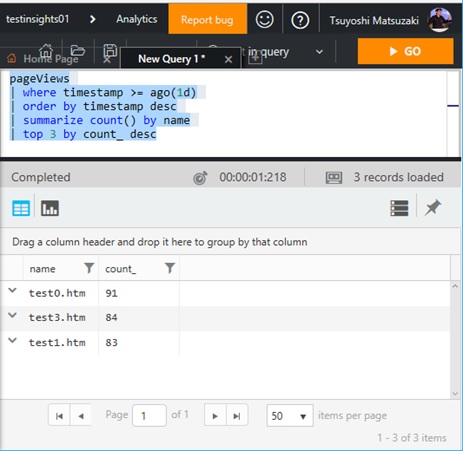
Please click [Analytics] in the Application Insights portal (Azure Portal), and the analytics portal window is opened. Just you input the following query in the query editor on the analytics portal, and press [Go].
pageViews| where timestamp >= ago(1d)| order by timestamp desc| summarize count() by name| top 3 by count_ descYou can get the query results in the analytics portal like the following screenshot.
Note : This is just the very simple example, and of course, you can use more advanced query. Please see “Application Insights : Reference for Analytics” for more analytics query functions and expressions.
Same as this analytics portal, you can also use the Apllication Insights REST API as follows.
Here “pageViews%20%7C%20where%20timestamp%20%3E=%20ago(1d)%20%7C%20order%20by%20timestamp%20desc%20%7C%20summarize%20count()%20by%20name%20%7C%20top%203%20by%20count_%20desc” is the url-encoded string of “pageViews | where timestamp >= ago(1d) | order by timestamp desc | summarize count() by name | top 3 by count_ desc“.
GET https://api.applicationinsights.io/beta/apps/{app id}/query?query=pageViews%20%7C%20where%20timestamp%20%3E=%20ago(1d)%20%7C%20order%20by%20timestamp%20desc%20%7C%20summarize%20count()%20by%20name%20%7C%20top%203%20by%20count_%20descAccept: application/jsonX-API-Key: {api key}HTTP/1.1 200 OKAccess-Control-Allow-Origin: *Content-Type: application/json; charset=utf-8{ "Tables": [{ "TableName": "Table_0", "Columns": [{ "ColumnName": "name", "DataType": "String", "ColumnType": "string"},{ "ColumnName": "count_", "DataType": "Int64", "ColumnType": "long"} ], "Rows": [[ "test0.htm", 91],[ "test3.htm", 84],[ "test1.htm", 83] ]},{ "TableName": "Table_1", "Columns": [{ "ColumnName": "Value", "DataType": "String", "ColumnType": "string"} ], "Rows": [[ "{"Visualization":"table","Title":"","Accumulate":false,"IsQuerySorted":true,"Annotation":"","By":null}"] ]},{ "TableName": "Table_2", "Columns": [{ "ColumnName": "Timestamp", "DataType": "DateTime", "ColumnType": "datetime"},{ "ColumnName": "Severity", "DataType": "Int32", "ColumnType": "int"},{ "ColumnName": "SeverityName", "DataType": "String", "ColumnType": "string"},{ "ColumnName": "StatusCode", "DataType": "Int32", "ColumnType": "int"},{ "ColumnName": "StatusDescription", "DataType": "String", "ColumnType": "string"},{ "ColumnName": "Count", "DataType": "Int32", "ColumnType": "int"},{ "ColumnName": "RequestId", "DataType": "Guid", "ColumnType": "guid"},{ "ColumnName": "ActivityId", "DataType": "Guid", "ColumnType": "guid"},{ "ColumnName": "SubActivityId", "DataType": "Guid", "ColumnType": "guid"},{ "ColumnName": "ClientActivityId", "DataType": "String", "ColumnType": "string"} ], "Rows": [[ "2016-11-28T08:05:12.6937983Z", 4, "Info", 0, "Query completed successfully", 1, "5d542224-9509-41f3-b1ea-f5f471fbb4ea", "5d542224-9509-41f3-b1ea-f5f471fbb4ea", "a264b37b-e980-4e49-9e21-7adc847099b1", "907ae68b-904d-4fcf-997f-c7e7efc39335"],[ "2016-11-28T08:05:12.6937983Z", 6, "Stats", 0, "{"ExecutionTime":0.0312509,"resource_usage":{"cache":{"memory":{"hits":388,"misses":0,"total":388},"disk":{"hits":0,"misses":0,"total":0}},"cpu":{"user":"00:00:00.0937500","kernel":"00:00:00.0468750","total cpu":"00:00:00.1406250"},"memory":{"peak_per_node":184550432}}}", 1, "5d542224-9509-41f3-b1ea-f5f471fbb4ea", "5d542224-9509-41f3-b1ea-f5f471fbb4ea", "a264b37b-e980-4e49-9e21-7adc847099b1", "907ae68b-904d-4fcf-997f-c7e7efc39335"] ]},{ "TableName": "Table_3", "Columns": [{ "ColumnName": "Ordinal", "DataType": "Int64", "ColumnType": "long"},{ "ColumnName": "Kind", "DataType": "String", "ColumnType": "string"},{ "ColumnName": "Name", "DataType": "String", "ColumnType": "string"},{ "ColumnName": "Id", "DataType": "String", "ColumnType": "string"} ], "Rows": [[ 0, "QueryResult", "PrimaryResult", "edbe4563-29ab-49e1-9da4-948fbd274f1e"],[ 1, "QueryResult", "@ExtendedProperties", "be0bf081-3a09-4767-9c7c-7f02209ec8ef"],[ 2, "QueryStatus", "QueryStatus", "00000000-0000-0000-0000-000000000000"] ]} ]}
Here I showed the overall concepts of Application Insights using SDK and API. For more about the SDK or API, please refer the following official document.
Application Insights API for custom events and metrics
https://docs.microsoft.com/en-us/azure/application-insights/app-insights-api-custom-events-metrics
Application Insights REST API documentation
https://dev.applicationinsights.io/documentation/overview
Categories: Uncategorized

Good Day I Am So Happy I Found Your Website, I
Found You By Mistake, While I Was Searching On Aol For
Something Else, Anyhow I Am Here Now And Would Just Like To Say Many Thanks For
A Remarkable Post And An All Round Entertaining Blog
I Don’t Have Time To Read It, All At The Moment But I Have BookMarked It
And Also Added In Your RSS Feeds, So When I Have Time I Will Be Back To Read More,
Please Do Keep Up The Fantastic Job.
LikeLike
I didn’t have this problem at all until recently, it first started showing 2 or three times a day, and I could open the page after a Refresh or two. But the problem intensified as days got by until today, I can’t open the page at all…
I’m using Chrome with Win. XP, service pack 3…
I also tried opening the page with FireFox and IE, but did not work either.
I’ve opened the page on other computers and it works perfectly fine…
I hope someone can help me
LikeLike