
(Separated from the original post.)
I introduce the cool app called E2D3. (If you’re using Excel 2013 or above, you can insert this app immediately.)
E2D3 for users – You can draw d3 visualization using your own data !
You know the d3.js is very cool library for “programmers” and not familiar with “users”. But E2D3 changes this situation.
The expression of d3 is not like the graph of standard Excel (which may be the bar chart, line chart, or pie chart), but it has extremely rich expression and visualization.
In US, it is well-known that New York Times often uses d3 for their expression. In Japan, also, E2D3 is used in digital media contents (Asahi Shimbun Digital), in which the population of Japanese political parties year by year is shown using the motion of the bar graph.
By Excel and E2D3, non-programmers can create their own graph using d3.
Just use it ! If you have Excel 2013, select [Insert] – [My Apps] and find E2D3 from store. (of course, it’s free !).
When you edit the data in Excel, the visualization also change. (You can also insert row and column.) If you finished editing, please press [Share Chart] button, and you can share this custom visualization in your web page.
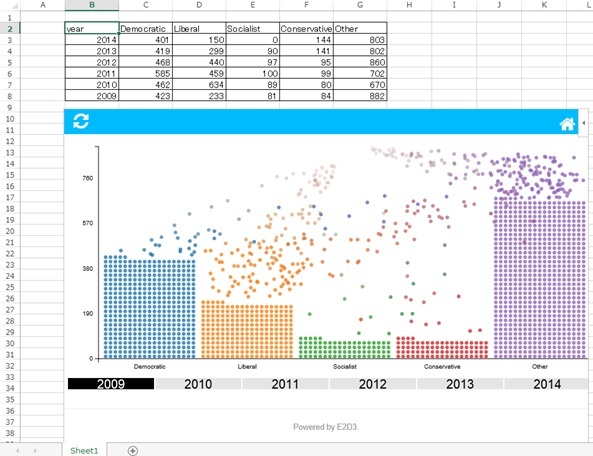
(This data is not the real data, just samples.)
E2D3 for programmers – You can add your own graph !
E2D3 is a community-driven open source !
For programmers, you can submit “pull request” at Github, and you can add your own expression (graph) in E2D3, if you need.
Please submit your nice shape and expression using JavaScript for all Excel users !
How to develop E2D3 expression (overall)
If you are Mac OS (OS X) user, you can download (clone) source from github and compile it.
- Build all sources (npm install)
- Start server (npm start)
- Create the manifest of app for office, and register to App catalog in Office 365
- Open using Excel Online, and debug using browser dev tool

If you are Windows user, you can use Visual Studio Community (free) for debugging.
I will explain this following.
Install software (for Windows users)
Please install the following software.
If you have Azure subscription, you can also use Azure VM image including Visual Studio Community.
- Excel 2013 (It’s okay to use trial of Office 365)
- Visual Studio Community (Free)
- Office Developer Tools for Visual Studio 2013 Update (Free)
Please install the Update of Office Developer Tools for Visual Studio 2013 for developing app for Office in VS Community. (The current version is Nov 2014 Update.)
Create the new expression of E2D3 (for Windows users)
The original source of E2D3 uses Node.js (gulp, coffee, etc). You can also use Node.js project in Visual Studio (need Node.js Tools for Visual Studio), but now you cannot use the Node project for app for office web project.
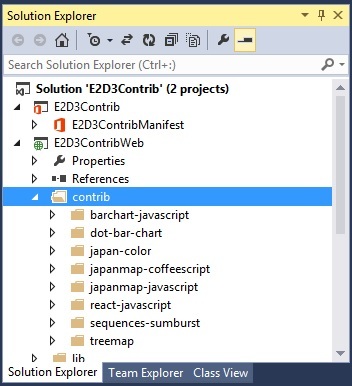
You can download “E2D3 VS project for expression creators” and please use this project. (This project is created by Visual Studio 2013.)
You can create the new expression (graph) by following steps.
- Create subfolder at “contrib” folder in Web Project
- Put main.js (the main logic of new graph), data.csv (sample data), thumbnail.png (thumbnail icon for graph)
You can also create main.coffee using coffeescript and Web Essentials 2013.
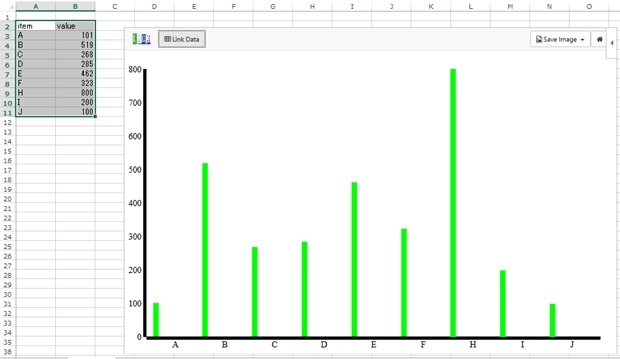
For example, let’s create the following main.js and data.csv.
data.csv
"item","value""A","101""B","519""C","268""D","285""E","462""F","323"main.js
//# require=d3/// <reference path="http://d3js.org/d3.v3.min.js" />var margin = { top: 20, right: 30, bottom: 30, left: 40 };var height = root.clientHeight - margin.top - margin.bottom;var width = root.clientWidth - margin.right - margin.left;// append svg graphicsvar chart = d3.select(root).append('svg') .attr('width', root.clientWidth) .attr('height', root.clientHeight) .append('g') .attr('transform', 'translate(' + margin.left + ',' + margin.top + ')');function update(data) { var jsonData = csv2json(data); // setup d3 scale var xScale = d3.scale.ordinal() .domain(jsonData.map(function (d) { return d.item; })) .rangeRoundBands([0, width], 0.1); var yMax = d3.max(jsonData, function (d) { return parseInt(d['value'], 10) + 1 }); var yScale = d3.scale.linear() .domain([0, yMax]) .range([height, 0]); // remove exsisting axis chart.selectAll('.axis').remove(); // draw x axis var xAxis = d3.svg.axis() .scale(xScale) .orient('bottom'); chart .append('g') .attr('class', 'x axis') .attr('transform', 'translate(0,' + (height - 1) + ')') .call(xAxis); // draw y axis var yAxis = d3.svg.axis() .scale(yScale) .orient('left'); chart .append('g') .attr('class', 'y axis') .call(yAxis); // draw bar var barSetup = function (selection) { selection .attr('class', 'bar') .attr('fill', '#0f0') .attr('width', 10) .attr('x', function (d) { return xScale(d['item']); }) .attr('y', function (d) { return yScale(d['value']); }) .attr('height', function (d) { return height - yScale(d['value']); }) }; chart .selectAll('.bar') // select all bar .data(jsonData) // set data .call(barSetup) // redraw existing data using new scale .enter() // enter to new data .append('rect') // insert new bar .call(barSetup) // draw new bar .exit() // exit from data .remove();}// create d3-style json from csv-style 2 dimension array//// [{"item", "value"},// {"A", "101"},// {"B", "519"}, ...]// -->// [{"item" : "A", "value" : "101"},// {"item" : "B", "value" : "519"}...]//function csv2json(csv) { var headers = []; for (var h = 0; h < csv[0].length; h++) { headers.push(csv[0][h]); } var results = []; for (var i = 1; i < csv.length; i++) { var row = {}; for (var j = 0; j < headers.length; j++) { row[headers[j]] = csv[i][j]; } results.push(row); } return results;}E2D3 always calls update() function.
This example is simply drawing the bar chart using d3, but you can also add some action seeing other graph samples in other foloders. (Please refer the d3.js document if you don’t know d3 well.)
By the first line of main.js (//# require=…), you can insert the requied library using requireJS. (This time, only d3.js is needed.)
By the 2nd line of main.js (/// <reference path=… />), you can use the intellisense for Visual Studio.
Quick debugging (for Windows users)
If you finish programming, you must insert the link for this graph in index.html. (This step is only needed for this VS project. The actual code of E2D3 reads all contribution scripts dynamically, and this step is not needed.)
Press F5, and start debugging ! You can see the simple graph in Excel.
If you change data, the graph is also changed. If you create the new row, select area, and press [Link Data] button, the graph is also changed.
Sorry but you cannot use breakpoints, because this uses requireJS. (Of course, it stops, if error occurs.)
But, you can use the quick start (debugging) using F5 in Visual Studio !
Reference :
The introduction of E2D3 (Hideyuki Takeuchi)
https://docs.google.com/presentation/d/1qVoaTueVDAZn9lzTE5E4K6Q2Dbim6HhDotsmaeXIBcQ/edit#slide=id.g2fe4cf2ad_0_114
Categories: Uncategorized

1 reply»