
See here for text featurization (embedding) in Python.
“MicrosoftML” package is powerful and can be used in the recent Microsoft R Server and R Client. Here I describe how you can use the text featurization (text vectorization) capabilities using this great package with simple sentiment example.
Note : Sorry, but now it’s available in Windows only (not Linux). Please wait for the update.
You can apply the text featurization into the sentiment analytics, spam filtering (classification), social analytics, etc. Note that the supported languages are English, French, German, Dutch, Italian, Spanish and Japanese (great !) now. (see MSDN for the latest update)
Sample DataSet
Here I use the sample dataset of Amazon book reputation which is having 975,194 records of rating and free text comment as follows. (see here for this dataset)
RATING REVIEW_TEXT2.0 This book has its good ...2.0 The fatalistic view of ...1.0 I was intrigued by the ...2.0 I admit, I haven't finished ......Train with text featurization
Now let’s see sample code with the text featurization. Please see the following example.
In the following example, the text featurizatoin is one of the transforms for trainings.
Before proceeding the linear regression, we featurize REVIEW_TEXT string, and store this featurized data (vector value) in the column named “Features” by the following featurizeText and selectFeatures transforms. In this example, the words which is used less than 500 times are all ignored. (If you just want to get the vector value, you can also use rxFeaturize().)
The following rxFastLinear is the function for the linear regression (or binary regression) which is entried in the new MML package, and it’s more fast than ever. rxFastLinear function analyzes this featurized data as input with the regression algorithm, and creates the function for the input of REVIEW_TEXT string and output of RATING numeric.
Note that this shows the very straight forward example for your understanding, and there exists the other consideration of modeling and tuning. (It’s not simple for the real production.)
For example, please consider the case he’s having extremely high positive (> 5.0). In this case, the rating will be just 5.0, because the maximum value is 5.0. That is, the rating value (numeric) is not strictly linear for the human sentiment and the model must be essentially the binary decision of positive/negative. Transform the data, use the logistic regression for the binary decision, and the confidence of this result will relate to the actual rating value. Or you must apply some other adjustments.
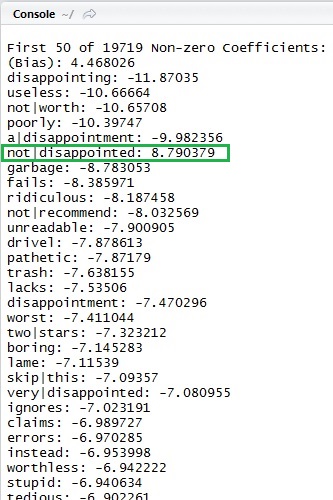
library(MicrosoftML)# read data (you can also use RxTextData)data <- read.table( "C:\tmp\all_tsv.review", col.names = c("RATING", "REVIEW_TEXT"), sep = "t", header = TRUE, quote = """, fileEncoding="UTF-8", stringsAsFactors = FALSE)# split data (total 975194 records)train <- data[1:900000,]# create transformstransformRule = list( featurizeText(vars = c(Features = "REVIEW_TEXT"),# ngramLength=2: include not only "Azure", "AD", but also "Azure AD"# skipLength=1 : "computer" and "compuuter" is the samewordFeatureExtractor = ngramCount( weighting = "tfidf", ngramLength = 2, skipLength = 1),language = "English" ), selectFeatures(vars = c("Features"),mode = minCount(500) ))# train using transforms !model <- rxFastLinear( RATING ~ Features, data = train, mlTransforms = transformRule, type = "regression" # not binary (numeric regression))summary(model,top = 50)By summary function, it shows the coefficients, and you can see many negative words and positive words (which I surrounded by the green rectangle) in the output.
In this example, we’re using 2 as n-gram value for the text featurization (see the source code above), and the words like “not|disappointed” are also estimated correctly as follows.
Predict (Scoring)
Now let’s predict some input text using the generated model.
The following is having 3 of input text, and the following screenshot shows the scored (predicted) rating results.
pred1 <- rxPredict( model, data = data.frame("REVIEW_TEXT"=c( "It's very easy to understand and useful for me.", "It's boring.", "Humm, it seems to be a lot of pages..."),"RATING"=c(0.0, 0.0, 0.0),stringsAsFactors = FALSE), extraVarsToWrite = c("REVIEW_TEXT"))
The next sample predicts the rating with new 700 records, and plots the relation of actual ratings and predicted ratings.
test <- data[920001:920700,]pred2 <- rxPredict( model, data = test, extraVarsToWrite = c("RATING", "REVIEW_TEXT"))plot(x = pred2$RATING, y = pred2$Score)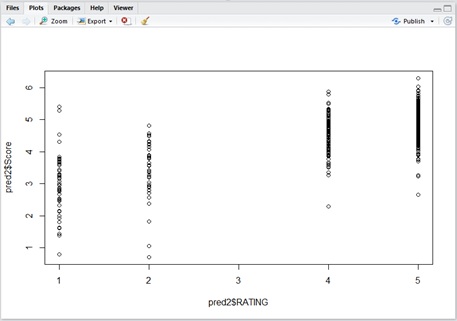
Note (Added on April 2017) : In Microsoft R 9.1 and later, the data transformation of getSentiment is added in MicrosoftML and you can retrieve the pre-trained sentiment score without any training data (but, English only).
[Reference]
MSDN : Introduction to MicrosoftML
https://msdn.microsoft.com/en-us/microsoft-r/microsoftml-introduction
Revolution Analytics Blog : Building a machine learning model with the MicrosoftML package
http://blog.revolutionanalytics.com/2017/01/microsoftml-taxi-trips.html
Categories: Uncategorized

Very good article. I found it useful while studying on a small college project
LikeLike
very helpful. thanks for posting….is there a way to hypertune these models?
LikeLike