
Azure VM Diagnostics (ARM モード)
- Windows Server 編
- Linux 編
こんにちは。
前回の「Azure VM (v2) の診断ログの構成 (Windows 編)」の続きとして、今回は Linux VM の構成方法を紹介します。ここでは、ASM ではなく、すべて ARM モードで構成します。(いくつか MSDN などに書かれていないポイントもありますので記載します。。。)
Microsoft Azure 上の Virtual Machine で、いわゆる「ログ」を考える場合、Azure Portal で Audit Log (監査ログ) として見えている Azure Resource の Provisioning Log、OS レベルのイベントなども含んだ Diagnostics (診断ログ)、Application レベルのモニタリングや可視化のためのさまざまなオプションを含んだ Application Insights の 3 つの方法があります。
本投稿では、このうち Azure Virtual Machine (VM) の Diagnostics (診断ログ) を対象に記載します。
もちろん、この Azure にビルトインされた診断機能を無理に使う必要はありませんが (例えば、コマンドやプログラムを経由して VM 上のログを直接参照しても構いません)、後述の通り簡単に利用できますので、この Azure にビルトインされた診断機能を理解しておいて損はないでしょう。
Azure VM における診断構成 (超概要)
Azure Portal を見てください。Virtual Machine (仮想マシン) を開くと表示される [Diagnostics] (診断) を選択すると、下図の通り、診断ログの出力を設定できます。(下記は Ubuntu Server の場合です。)
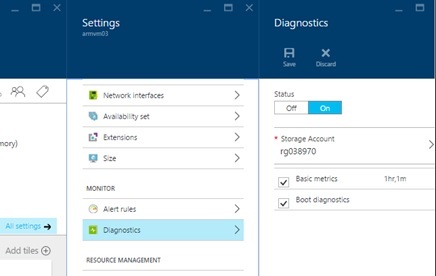
ログのカスタマイズ方法などは後述しますが、Azure VM 上で稼働している VM Agent によって Syslog (/var/log/syslog) の内容が参照され、既定では「Azure Linux VM Infrastructure Monitoring and Diagnostics」に記載されている多数の Metrics (Memory Available, CPU User Time Percentage, 等々) が収集されて、これらが Azure Table Storage に保存されています。
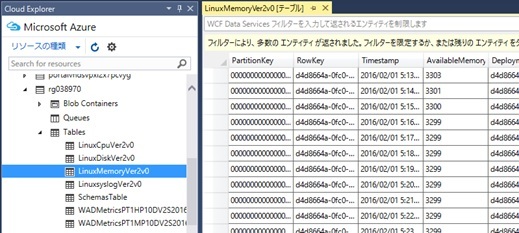
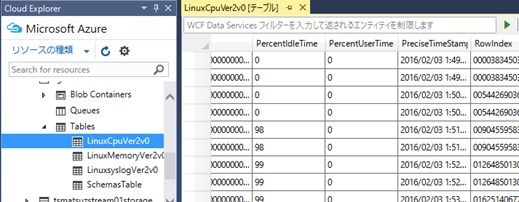
このため、ユーティリティやプログラム (REST) などを使って、この収集された内容を参照できます。(下図は、Visual Studio の Cloud Explorer から Azure Table Storage を参照しています。)
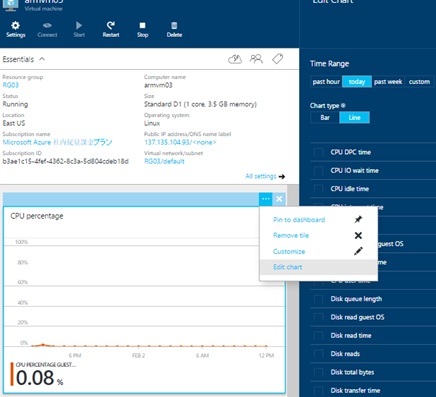
基本的な Metrics は、Azure Portal の「Monitoring」ブレードを使って (時系列に) ビジュアルに表示することも可能です。(下図の通り、[Edit Chart] を選択して、表示する Metrics も変更できます。)
なお、上図の Azure Portal で選択可能な「Boot Diagnostics」(Boot 時の Hypervisor レベルの出力結果を確認できます) は IaaS v2 (ARM ベースの Azure Virtual Machine) から導入されたもので、ここで解説する json を使った診断構成とは別の仕組みです。(内部的には Hypervisor レベルの出力結果がイメージ ファイルとして Azure Blob Storage に保存され、Azure Portal から参照できるようになっています。) ここでは、この Boot Diagnostics の解説はおこないませんが、詳細は「Boot Diagnostics for Virtual Machines v2」を参照してください。
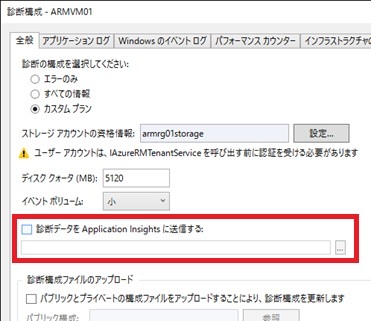
補足 : ここでは Application Insights の解説はしませんが、ここで紹介する診断ログ (Diagnostics) を Application Insights に送ってビジュアルに可視化することもできます。(下図は Visual Studio を使って構成している例です。)
補足 (2016/04 追記) : Azure Diagnostics を Event Hub に Stream 送信することが可能になりました。これにより、Stream Analytics, HDInsight, Machine Learning などと組み合わせた高度な分析で活用することもできます。(詳細は「Microsoft Azure : New features for Azure diagnostics and Azure Audit logs」を参照してください。)
Azure CLI による設定 – Linux Diagnostics 新機能
コマンド (Azure CLI, PowerShell) や Resource manager template を使うと、診断内容をより細かくカスタマイズできます。以降では、この方法を見ながら、内部の仕組みを理解していきましょう。
上記のように Azure Portal (UI) を使って診断 (Diagnostics) を構成すると、その構成内容は、「Azure VM (v2) の診断ログの構成 (Windows 編)」で解説した難解な XML として構成されています。(下図は Azure Resource Explorer で構成結果を確認した例です。下記の xmlCfg には、XML が Base 64 エンコードされています。)
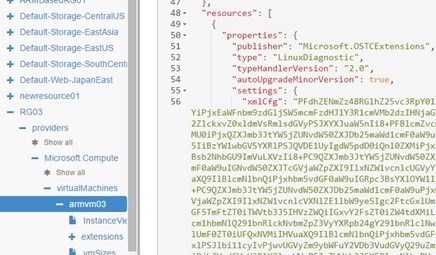
実は、Linux 診断のための Azure VM extension である Linux Diagnostics (type 名 : LinuxDiagnostic) の最新版 (v2.2 以上) を使うと、この難解な XML による構成以外に、json を使った構成を使うことができます。ここでは、Azure CLI (コマンド ユーティリティ) を使って、この構成方法を紹介しましょう。(Windows PowerShell で同様の構成もおこなえますが、今回は Linux 利用者を対象に Azure CLI を使います。)
補足 : なお、Windows PowerShell を使用して下記と同じことをする場合は、Set-AzureRmVMDiagnosticsExtension ではなく Set-AzureRmVMExtension を使います。(ここでは、この説明はしません。)
例えば、Azure CLI を使って、診断 (Linux Diagnostics Extension) が設定されていない VM に新規に診断を設定する場合は、下記の通り実行できます。
// login to Azure and set arm modeazure loginazure config mode arm// set vm extension for linuxazure vm extension set --resource-group "testrg01" --vm-name "testvm01" --publisher-name "Microsoft.OSTCExtensions" --version 2.2 --name "LinuxDiagnostic" --private-config-path /Users/tsuyoshi.matsuzaki/private.json --public-config-path /Users/tsuyoshi.matsuzaki/public.json上記の private.json ファイル、public.json ファイルには、それぞれ、下記のような json を記述します。(ARM の構成上は、public.json の内容のみが表示されます。)
private.json には Diagnostics の保存先となる Storage Account の Name と Key、public.json には出力内容を指定します。今回は、Memory の使用量 (UsedMemory)、空き容量 (AvailableMemory)、CPU の使用率 (PercentUserTime) などを取得し、Memory に関する情報、CPU に関する情報を、それぞれ、Azure Table の LinuxMemory{version}、LinuxCpu{version} に抽出するように指定しています。なお、ここで指定している WQL (query) で指定可能なスキーマの内容は「CodePlex : System Center Cross Platform Providers for Linux and UNIX」に記載されていますので参照してください。(SCX_ProcessorStatisticalInformation, SCX_MemoryStatisticalInformation, SCX_DiskDriveStatisticalInformation, SCX_FileSystemStatisticalInformation, SCX_UnixProcessStatisticalInformation などが使用できます。)
--private-config-path, --public-config-path オプションを使わずに、--private-config, --public-config オプションで json を (コマンド内に) 直書きしても構いません。(指定可能なオプションは azure vm extension set -help で確認できます。)
private.json
{ "storageAccountName":"myaccount", "storageAccountKey":"0S6xhGECl5..."}public.json
{ "perfCfg":[{ "query":"SELECT PercentAvailableMemory, AvailableMemory, UsedMemory FROM SCX_MemoryStatisticalInformation", "table":"LinuxMemory"},{ "query":"SELECT PercentIdleTime, PercentUserTime FROM SCX_ProcessorStatisticalInformation", "table":"LinuxCpu"} ], "EnableSyslog" : "true"}Azure Table を確認すると、下図の通り希望する Metrics が、それぞれの Table に抽出されます。
注意 : なお、この方式で取得した診断データは、上述の Azure Portal の Monitoring ブレードで認識されないようなので注意してください。Auto-Scaling を構成する場合などには、従来通りの xmlCfg (XML スキーマ) を使った方法で構成しないといけないかも。。。(すみません、まだ試してませんので、時間があるときに見ておきます)
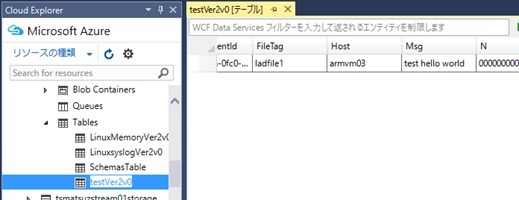
また、独自のログ ファイルやエラー ファイルをトラックするには、下記の通り fileCfg を指定します。(この際も、perfCfg は必須なので、必ず記載しておいてください。また、EnableSyslog は必ず true に設定しておいてください。)
{ "perfCfg":[{ "query":"SELECT PercentAvailableMemory, AvailableMemory, UsedMemory FROM SCX_MemoryStatisticalInformation", "table":"LinuxMemory"} ], "fileCfg" : [{ "file":"/var/log/test.log", "table":"test"} ], "EnableSyslog" : "true"}Azure Table を確認すると、下図の通り、/var/log/test.log に書き込まれた内容が test{version} という Table に書き込まれているのが確認できます。
既に設定済の Diagnostics の変更をおこなうには、下記の通り、いったん削除してから新規設定をおこなうと良いでしょう。(Name がわからない場合は、azure vm extension get コマンドや、Azure Resource Explorer などで確認できます。)
// Remove default diagnostics extensionazure vm extension set --resource-group "testrg01" --vm-name "testvm01" --name "Microsoft.Insights.VMDiagnosticsSettings" --publisher-name "Microsoft.OSTCExtensions" --version 2.0 --uninstallResource manager template を使った構成
「Azure Resource Manager の template の How-to」で解説した Resource manager template を使って Diagnostics Extension を構成する場合も、上述の通り、XML による構成 (xmlCfg) と、json による構成の 2 通りの構成方法があります。ここでは、やはり、json を使った構成方法を紹介します。
補足 : xmlCfg を使った Resource manager template のサンプルは、例えば「azure-quickstart-templates / 201-vmss-ubuntu-autoscale」などを見ていただくと良いでしょう。(ベースの概念は「Azure VM (v2) の診断ログの構成 (Windows 編)」で解説した内容と同様です。)
Resource manager template を使用する場合、上述の private config と public config に相当する内容を、下記の通り、protectedSettings と settings に記述するだけです。
{ "$schema": "https://schema.management.azure.com/schemas/2015-01-01/deploymentTemplate.json#", "contentVersion": "1.0.0.0", "parameters": {}, "variables": {}, "resources": [{ "type": "Microsoft.Storage/storageAccounts", "name": "tsmatsuzteststorage", "apiVersion": "2015-06-15", "location": "East US", "properties": {"accountType": "Standard_GRS" }},{ "apiVersion": "2015-06-15", "type": "Microsoft.Network/publicIPAddresses", "name": "testip", "location": "East US", "properties": {"publicIPAllocationMethod": "Dynamic","dnsSettings": { "domainNameLabel": "endpointtest"} }},{ "apiVersion": "2015-06-15", "type": "Microsoft.Network/virtualNetworks", "name": "testvnet", "location": "East US", "properties": {"addressSpace": { "addressPrefixes": ["10.0.0.0/16" ]},"subnets": [ {"name": "testsubnet","properties": { "addressPrefix": "10.0.0.0/24"} }] }},{ "apiVersion": "2015-06-15", "type": "Microsoft.Network/networkInterfaces", "name": "testnic", "location": "East US", "dependsOn": ["Microsoft.Network/publicIPAddresses/testip","Microsoft.Network/virtualNetworks/testvnet" ], "properties": {"ipConfigurations": [ {"name": "testipconfig","properties": { "privateIPAllocationMethod": "Dynamic", "publicIPAddress": {"id": "[resourceId('Microsoft.Network/publicIPAddresses', 'testip')]" }, "subnet": {"id": "[concat(resourceId('Microsoft.Network/virtualNetworks', 'testvnet'), '/subnets/testsubnet')]" }} }] }},{ "apiVersion": "2015-06-15", "type": "Microsoft.Compute/virtualMachines", "name": "testvm", "location": "East US", "dependsOn": ["Microsoft.Storage/storageAccounts/tsmatsuzteststorage","Microsoft.Network/networkInterfaces/testnic" ], "properties": {"hardwareProfile": { "vmSize": "Standard_D1"},"osProfile": { "computerName": "testvm", "adminUsername": "demouser", "adminPassword": "P@ssw0rd01"},"storageProfile": { "imageReference": {"publisher": "Canonical","offer": "UbuntuServer","sku": "14.04.2-LTS","version": "latest" }, "osDisk": {"name": "osdisk","vhd": { "uri": "http://tsmatsuzteststorage.blob.core.windows.net/vhds/os.vhd"},"caching": "ReadWrite","createOption": "FromImage" }, "dataDisks": [{ "name": "datadisk1", "diskSizeGB": "100", "lun": 0, "vhd": {"uri": "http://tsmatsuzteststorage.blob.core.windows.net/vhds/data.vhd" }, "createOption": "Empty"} ]},"networkProfile": { "networkInterfaces": [{ "id": "[resourceId('Microsoft.Network/networkInterfaces','testnic')]"} ]} }, "resources": [{ "type": "extensions", "name": "testdiag", "apiVersion": "2015-06-15", "location": "East US", "dependsOn": ["Microsoft.Compute/virtualMachines/testvm" ], "properties": {"publisher": "Microsoft.OSTCExtensions","type": "LinuxDiagnostic","typeHandlerVersion": "2.2","autoUpgradeMinorVersion": false,"settings": { "perfCfg": [{ "query": "SELECT PercentAvailableMemory, AvailableMemory, UsedMemory FROM SCX_MemoryStatisticalInformation", "table": "LinuxMemory"} ], "fileCfg": [{ "file": "/var/log/test.log", "table": "test"} ], "EnableSyslog": "true"},"protectedSettings": { "storageAccountName": "tsmatsuzteststorage", "storageAccountKey": "[listKeys(resourceId('Microsoft.Storage/storageAccounts', 'tsmatsuzteststorage'),'2015-06-15').key1]"} }} ]} ], "outputs": {}}Resource manager template で簡単に記述できるので、ARM ベースの REST API を使って、プログラムなどから診断構成の設定や参照もおこなえます。(Azure REST API については「Azure Resource (ARM) の REST API による管理」を参照してください。)
Categories: Uncategorized
